Python Weather Analysis#
In this notebook, we will perform a basic weather data analysis using Python. We will:
Load weather data from a CSV file using pandas.
Visualize the first few rows of the table.
Summarize the table and show the information of the dataframe.
Compute the mean and maximum temperature from the data.
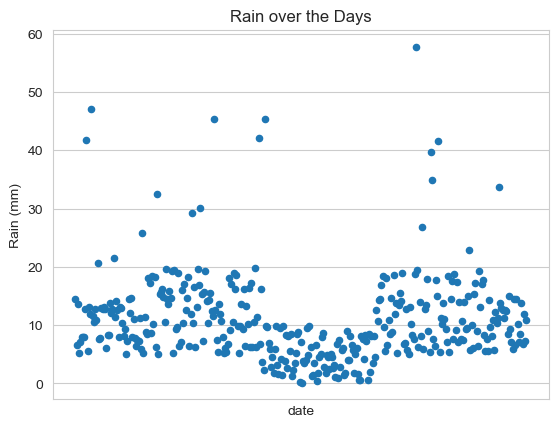
Create a scatter plot of rain over the days using pandas plotting methods.
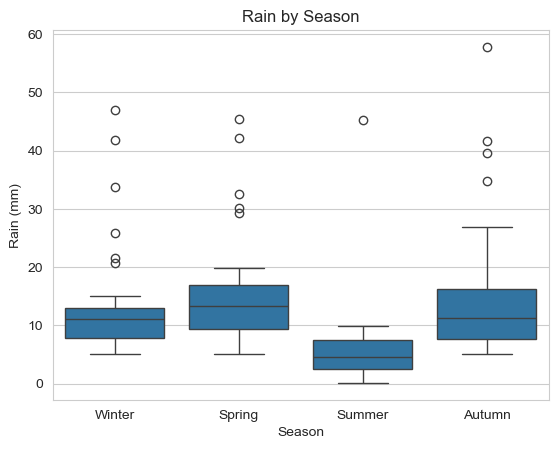
Group the data by seasons and plot a boxplot of the rain data for the four seasons using seaborn.
Disclaimer#
This code is generated by an AI model using the bia-bob project. It is good scientific practice to check the code and results it produces carefully.
Import Libraries#
First, we will import the necessary libraries for our analysis.
import pandas as pd
import matplotlib.pyplot as plt
import seaborn as sns
Load Weather Data#
We will load the weather data from a CSV file called german_weather_2023.csv using pandas.
df = pd.read_csv('german_weather_2023.csv')
Visualize the Head of the Table#
Let’s have a look at the first few rows of the dataframe to understand the structure of the data.
display(df.head())
| date | temperature | rain | |
|---|---|---|---|
| 0 | 2023-01-01 | -1.254599 | 14.507143 |
| 1 | 2023-01-02 | 0.986585 | 6.560186 |
| 2 | 2023-01-03 | -4.419164 | 13.661761 |
| 3 | 2023-01-04 | 2.080726 | 5.205845 |
| 4 | 2023-01-05 | 3.324426 | 7.123391 |
Summarize the Table and Show Info#
We will summarize the dataframe and show its info to understand the columns and types of data we are dealing with.
print(df.describe())
       temperature        rain
count   365.000000  365.000000
mean     10.708104   10.959650
std       8.545935    7.639665
min      -4.944779    0.145447
25%       5.143935    6.272566
50%      10.427244    9.456826
75%      15.182317   13.961197
max      29.949553   57.799883
print(df.info())
<class 'pandas.core.frame.DataFrame'>
RangeIndex: 365 entries, 0 to 364
Data columns (total 3 columns):
 #   Column       Non-Null Count  Dtype
---  ------       --------------  -----
 0   date         365 non-null    object
 1   temperature  365 non-null    float64
 2   rain         365 non-null    float64
dtypes: float64(2), object(1)
memory usage: 8.7+ KB
None
Compute Mean and Maximum Temperature#
Next, we will compute the mean and maximum temperature from the temperature column in the dataframe.
mean_temperature = df['temperature'].mean()
max_temperature = df['temperature'].max()
print(f'Mean Temperature: {mean_temperature}')
print(f'Maximum Temperature: {max_temperature}')
Mean Temperature: 10.708104411661468
Maximum Temperature: 29.949552556108586
Scatter Plot of Rain Over Days#
We will use pandas’ internal plotting methods to create a scatter plot of rain over the days, omitting the x-axis labels to not clutter the plot.
df.plot.scatter(x='date', y='rain', xlabel='date', ylabel='Rain (mm)', title='Rain over the Days')
plt.xticks([])
plt.show()

Group Data by Seasons#
We will group the data by seasons (Winter, Spring, Summer, Autumn) by associating the months of the year and then plot a boxplot of rain in the four seasons using seaborn.
def get_season(month):
    if month in [12, 1, 2]:
        return 'Winter'
    elif month in [3, 4, 5]:
        return 'Spring'
    elif month in [6, 7, 8]:
        return 'Summer'
    else:
        return 'Autumn'

df['season'] = pd.to_datetime(df['date']).dt.month.apply(get_season)
sns.boxplot(x='season', y='rain', data=df)
plt.title('Rain by Season')
plt.xlabel('Season')
plt.ylabel('Rain (mm)')
plt.show()

