AI-assisted Python code generation using BiA-Bob#
bia_bob is a Python library that connects Jupyter with large language models (LLM) and custom bio-image and data analysis instructions.
When using bia-bob to prompt LLMs, the prompts you enter including existing variable names etc. are sent to the LLM provider. If you work with remote commercial providers, do not submit any sensitive, secret or private information. Alternatively, you can use This code can be used to list the models available on Helmholtz’ Blablador LLM server. First, you need to retrieve an API-Key as explained here. Then, you need to enter this key in a new file named .env in the folder where you would like to create Jupyter Notebooks like the one below. The .env file should look like this:
BLABLADOR_API_KEY="glpat-your-key-continues-here"
If bia-bob is not installed yet, run this code in a new cell below:
!pip install bia-bob
Then, you can configure bia-bob:
from dotenv import load_dotenv
load_dotenv()

import os
from bia_bob import bob
bob.initialize(endpoint='https://api.helmholtz-blablador.fz-juelich.de/v1', model='1 - GPT-OSS-120b - an open model released by OpenAI in August 2025', api_key=os.environ.get('BLABLADOR_API_KEY'))
Prompting#
You can prompt for a single short task using %bob.
%bob print hello world.
Print the phrase hello world to the console.
print("hello world")
More advanced multi-line tasks can be prompted using %%bob.
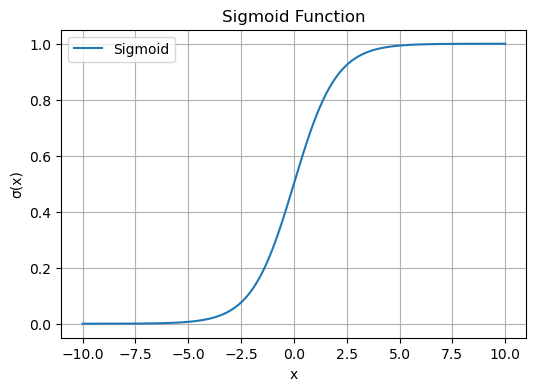
%%bob
plot a sigmoid
I will generate data for a sigmoid function and plot it using matplotlib.
import os
import numpy as np
import matplotlib.pyplot as plt

# 1. Generate x values
x = np.linspace(-10, 10, 400)

# 2. Compute sigmoid
y = 1 / (1 + np.exp(-x))

# 3. Plot
plt.figure(figsize=(6, 4))
plt.plot(x, y, label='Sigmoid')
plt.title('Sigmoid Function')
plt.xlabel('x')
plt.ylabel('σ(x)')
plt.grid(True)
plt.legend()
plt.show()