
Visualizing text embeddings#
In this notebook we will visualize UMAP representations of text embeddings together with word clouds generated from the underlying text data.
import pandas as pd
import stackview
import numpy as np
import yaml
with open("phd_topics.yml", 'r') as file:
    data_dict = yaml.safe_load(file)
df = pd.DataFrame(data_dict)
df.head()
| TSNE0 | TSNE1 | UMAP0 | UMAP1 | embedding | name | research_field | selection | topic | |
|---|---|---|---|---|---|---|---|---|---|
| 0 | -0.493792 | 4.062089 | 3.046537 | 6.063922 | [-0.0015439987182617188, 0.027496337890625, -0... | Taylor Reed | Software Engineering | 1 | Runtime Verification of Adaptive Microservice ... |
| 1 | -8.435922 | -3.336321 | 8.712546 | 9.976731 | [0.0090789794921875, 0.0286865234375, -0.01675... | Riley Jain | Robotics | 1 | Learning‑Based Resilient Coordination of Heter... |
| 2 | -13.315869 | -13.535236 | 10.478408 | 10.329826 | [-0.00688934326171875, 0.01209259033203125, -0... | Taylor Adams | Computer Vision | 1 | Unsupervised Spatiotemporal Representation Lea... |
| 3 | 5.813048 | 3.473648 | 2.961483 | 7.911003 | [-0.0050506591796875, 0.0226898193359375, -0.0... | Devon Thomas | Machine Learning | 1 | Uncertainty‑Aware Reinforcement Learning for A... |
| 4 | -1.530018 | -1.797050 | -0.876287 | 8.270097 | [0.03546142578125, 0.03033447265625, -0.026321... | Alex Lee | Computational Complexity | 1 | Fine‑Grained Complexity of Dynamic Subgraph Is... |
import ipywidgets as widgets

# original wordcloud widget
wc = stackview.wordcloudplot(df, column_text="topic", column_x="UMAP0", column_y="UMAP1")

# new controls
show_btn = widgets.Button(description="Show solution")
reset_btn = widgets.Button(description="Reset")
label = widgets.Textarea(
    value="",
    placeholder="",
    description="",
    disabled=True,  # read-only
    layout=widgets.Layout(width='70%', height='150px')
)

code_text = """
"""

def on_show(b):
    # 1. Filter rows where selection == 1
    filtered = df[df['selection'] == 1]

    # 2. Get unique values (excluding NaNs) and sort them for readability
    label.value = "\n".join(np.unique(filtered['research_field'].dropna()))

def on_reset(b):
    label.value = ""

wc.observe(on_reset)

show_btn.on_click(on_show)
reset_btn.on_click(on_reset)

controls = widgets.HBox([show_btn, reset_btn, label])
ui = widgets.VBox([wc, controls])

# display the combined UI (putting ui as last expression will display it in a notebook)
ui
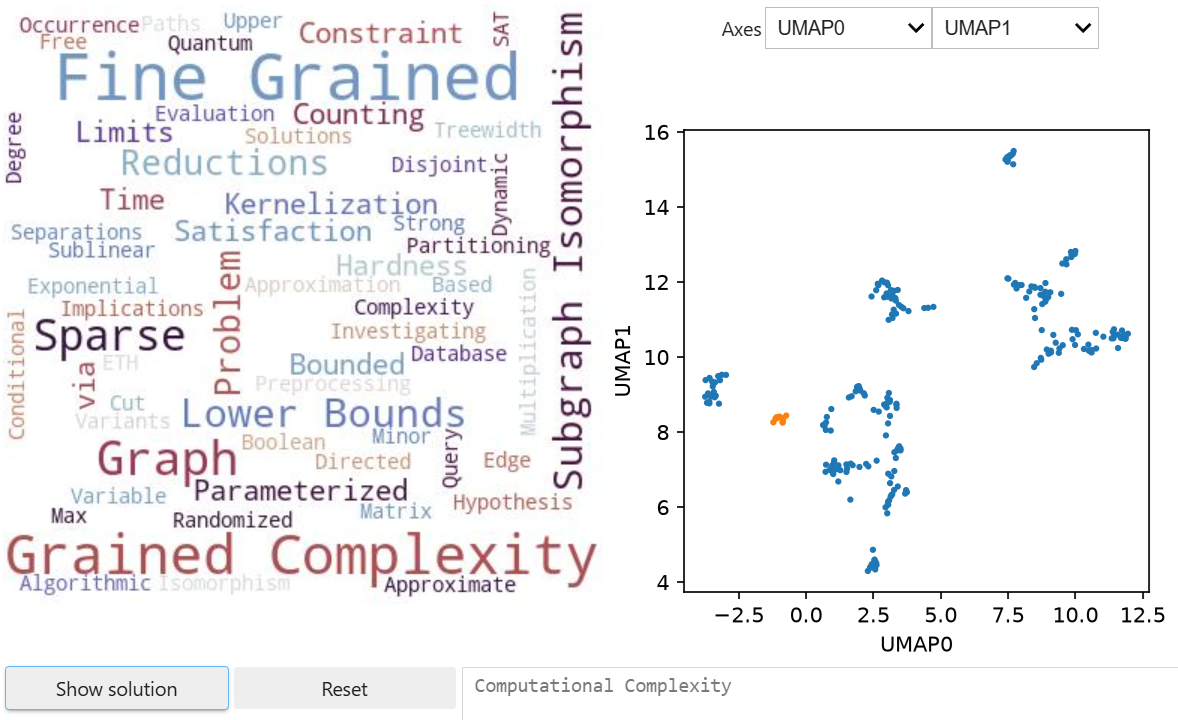
When executing this notebook locally, this graphical interface will appear. You can draw outlines around point clouds and the wordcloud will update. From the wordcloud of PhD topics you can guess in which domain the researchers might work. You can test if your guess is right by clicking the Show solution button at the bottom.
Exercise#
Explore the clustered data points by drawing outlines around clusters. Can you guess the research field?