Github Copilot#
Basic plotting requests#
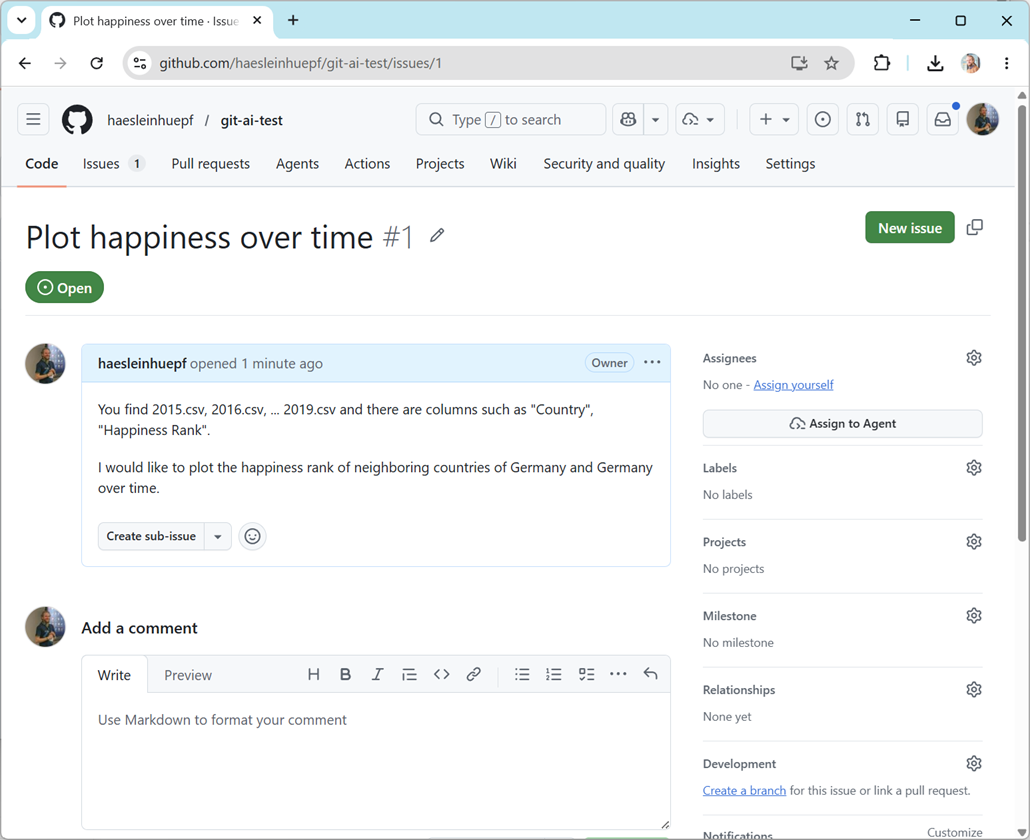
First, we start by creating a new Github issue. Navigate to your repository where the world happiness data is stored and create a new issue, e.g.:
You find 2015.csv, 2016.csv, ... 2019.csv and there are columns such as "Country", "Happiness Rank".

I would like to plot the happiness rank of neighboring countries of Germany and Germany over time.
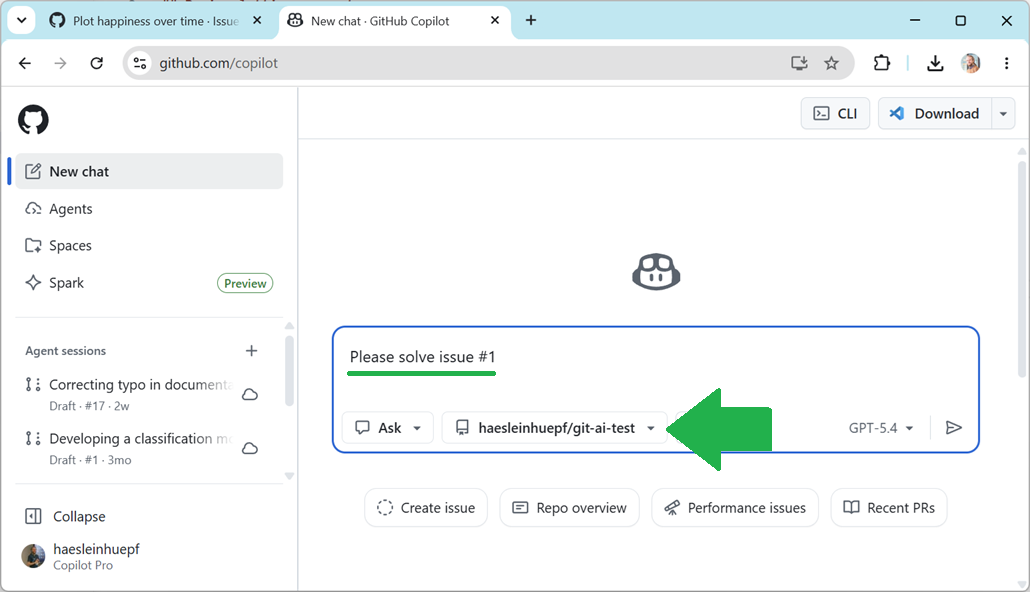
Afterwards, navigate to the Github Copilot page and ask Copilot to solve the issue:
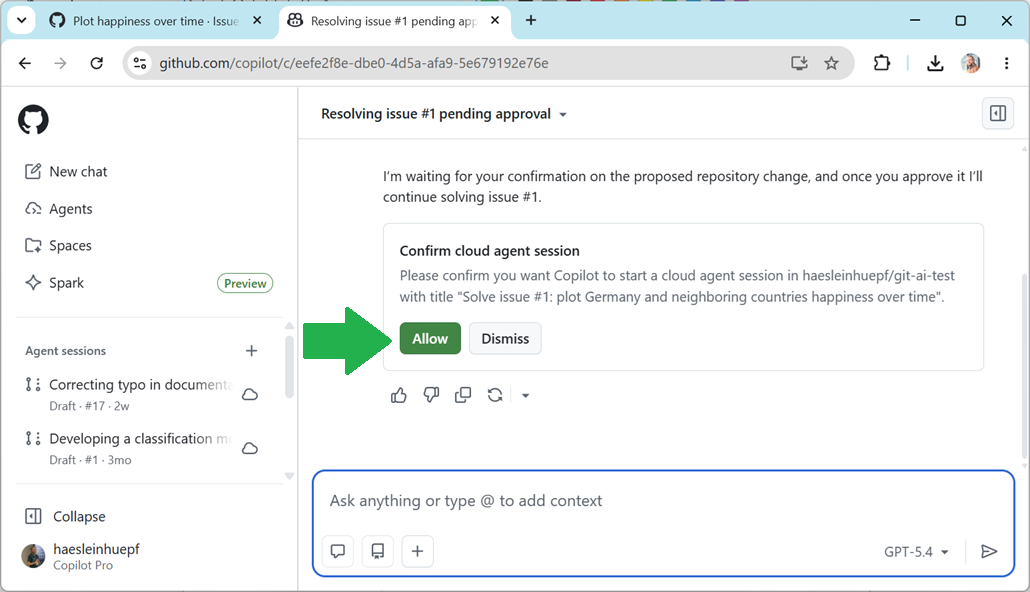
Confirm that a cloud session is started for this:
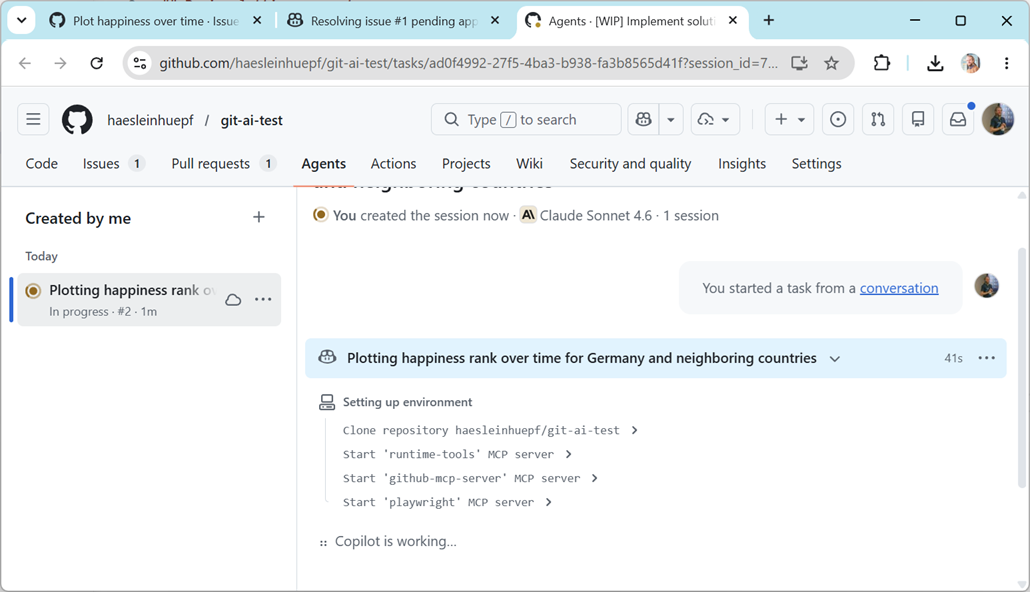
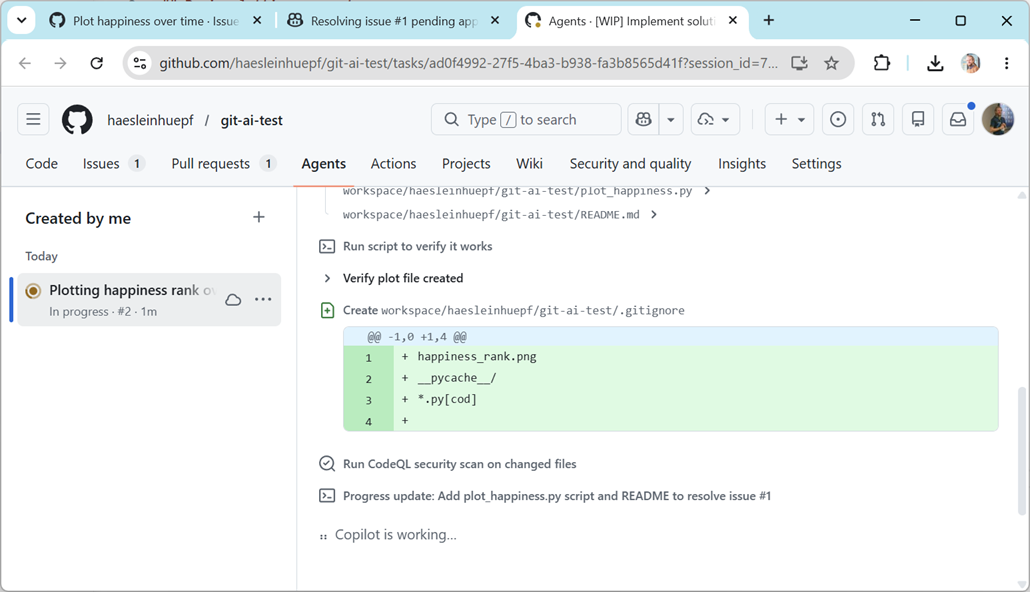
Optionally, follow the copilot solving your issue:
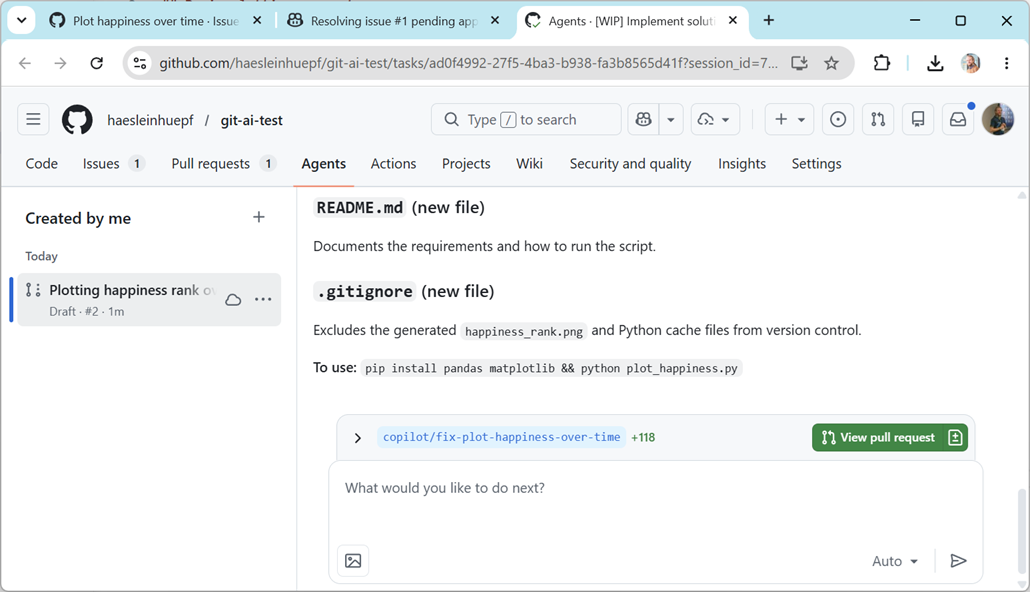
At some point Copilot will finish and you can click on View Pull-Request.
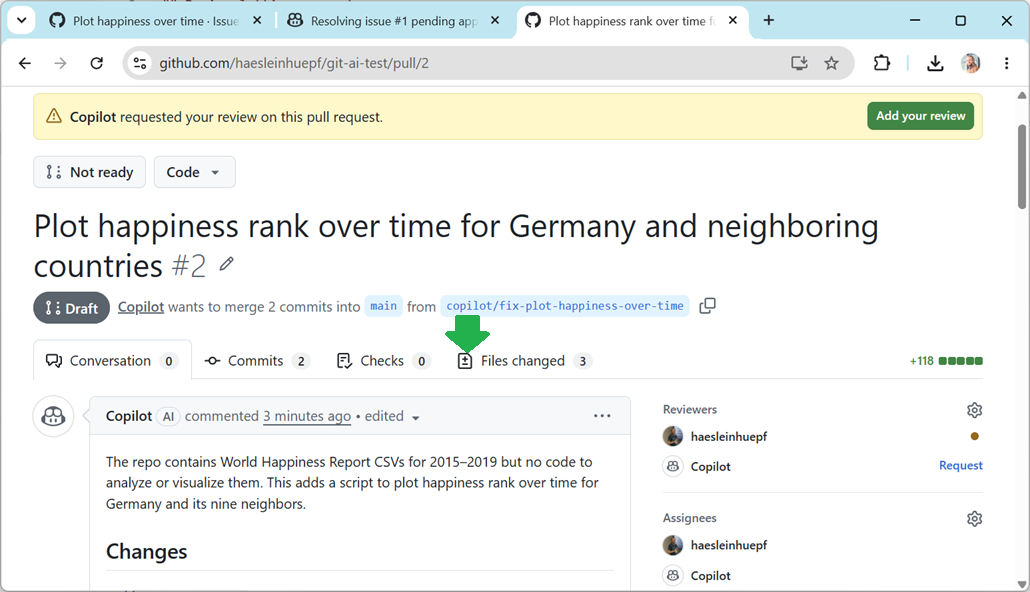
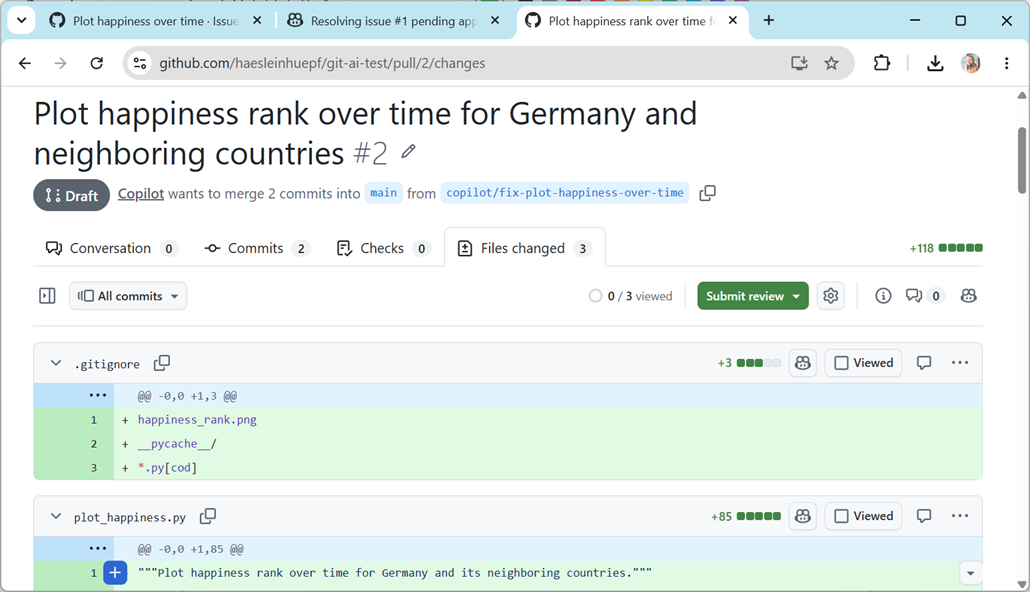
Review this Pull-Request carefully, e.g. by clicking on the Files tab.
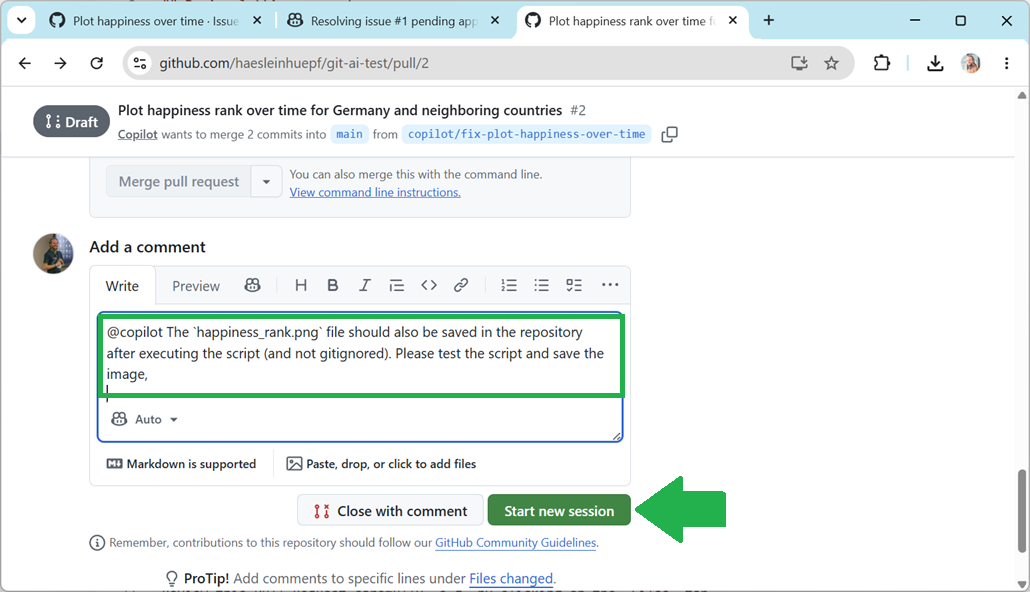
You can also ask Copilot for modifications.

Copilot will the confirm that it has seen you request:
Continue the discussion with Copilot until it has shown you the plot.