AllHands / OpenHands#
Basic plotting requests#
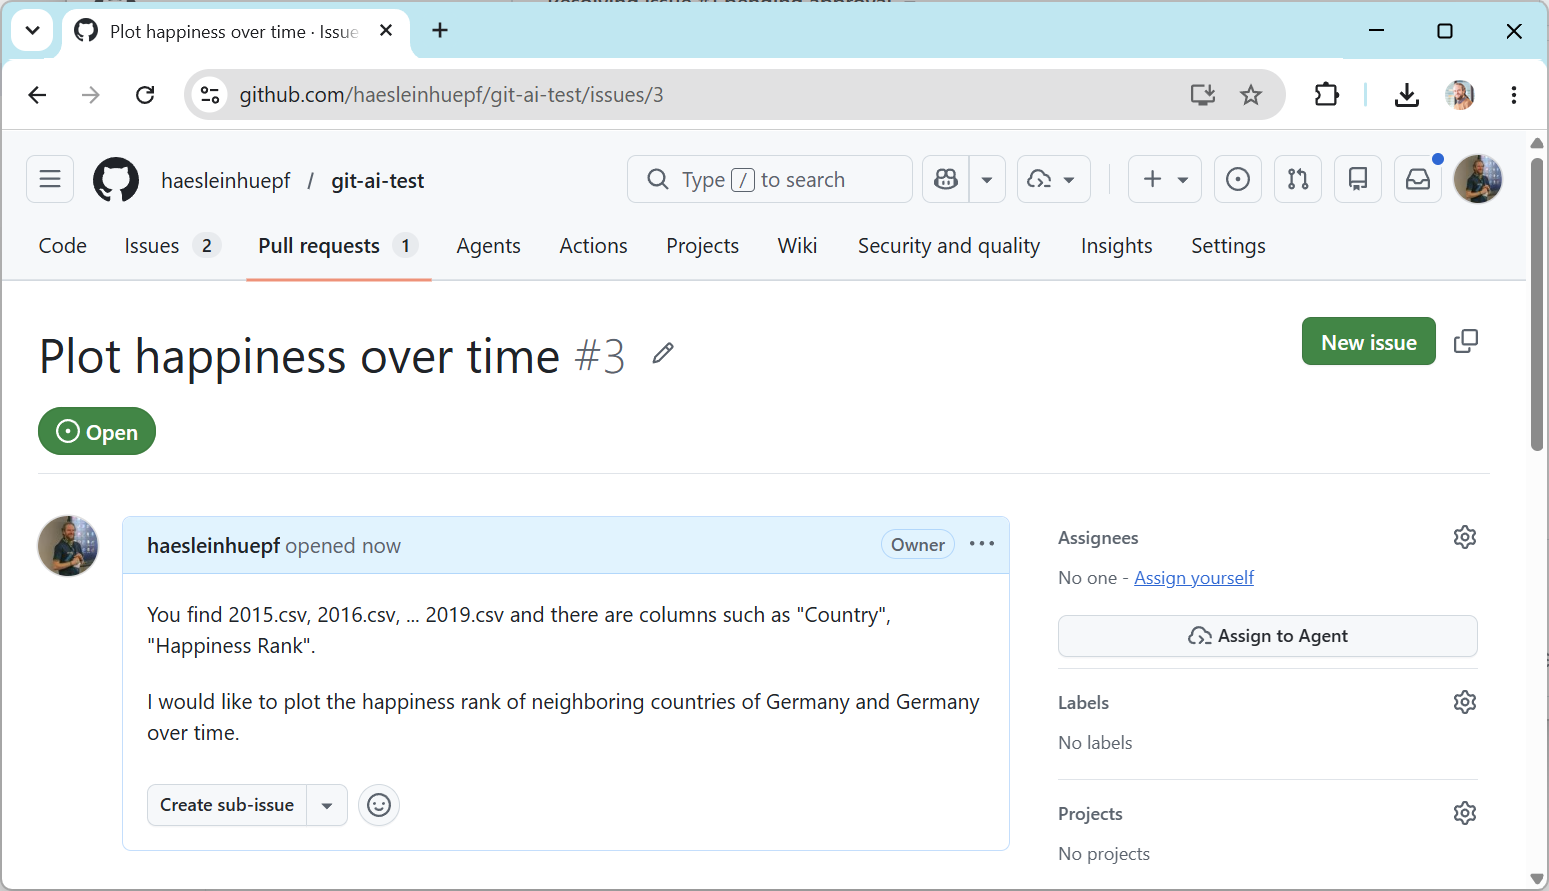
First, we start by creating a new Github issue. Navigate to your repository where the world happiness data is stored and create a new issue, e.g.:
You find 2015.csv, 2016.csv, ... 2019.csv and there are columns such as "Country", "Happiness Rank".

I would like to plot the happiness rank of neighboring countries of Germany and Germany over time.
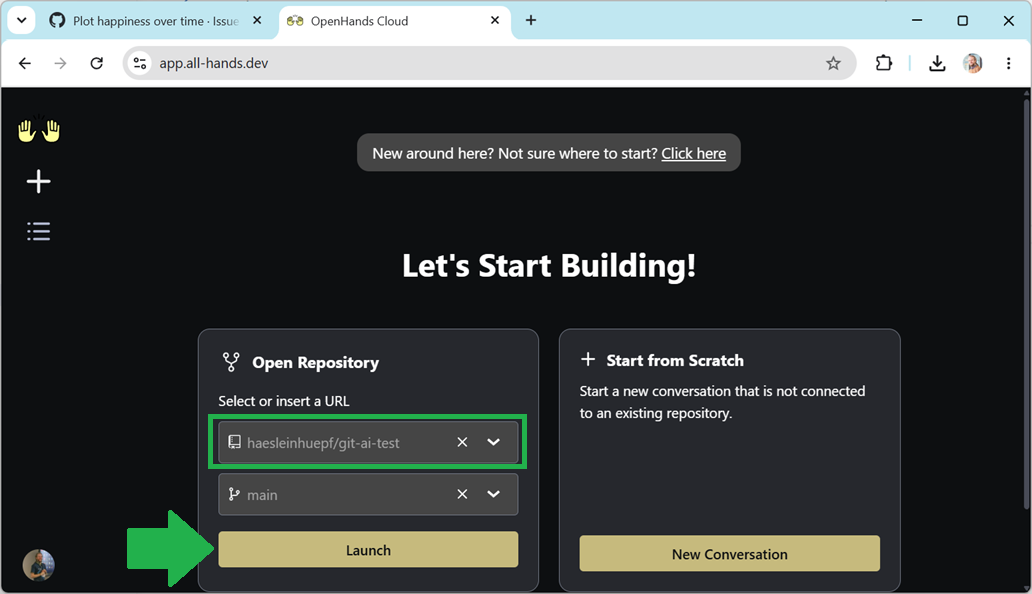
Navigate to openhands.dev, and click on “Try it live”.
Login using your Github account. Select your repository
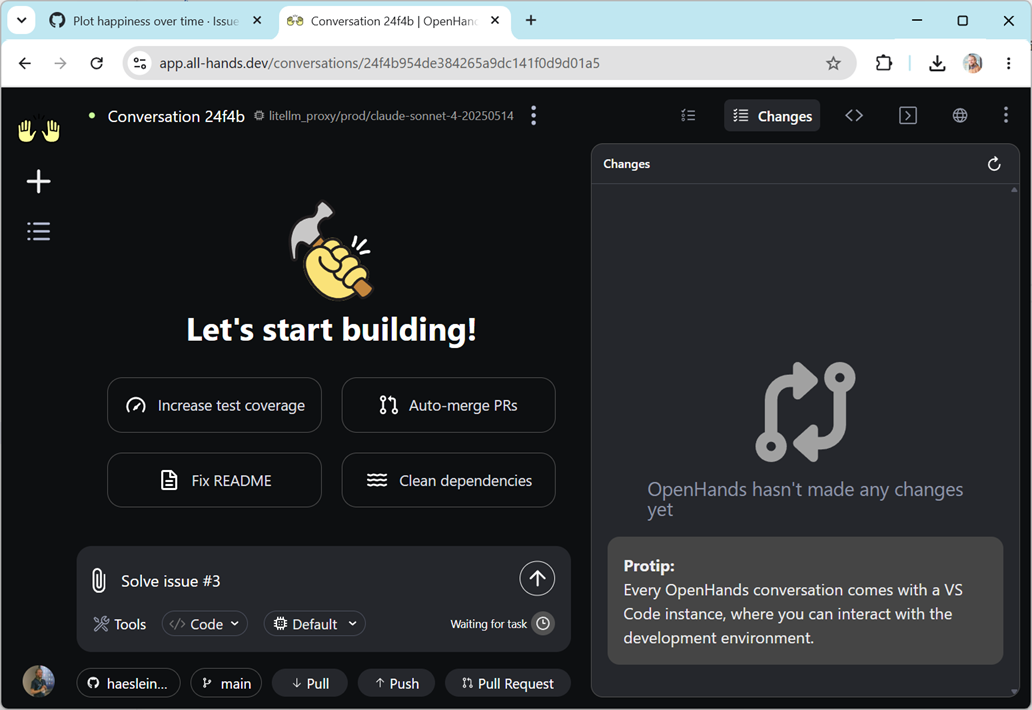
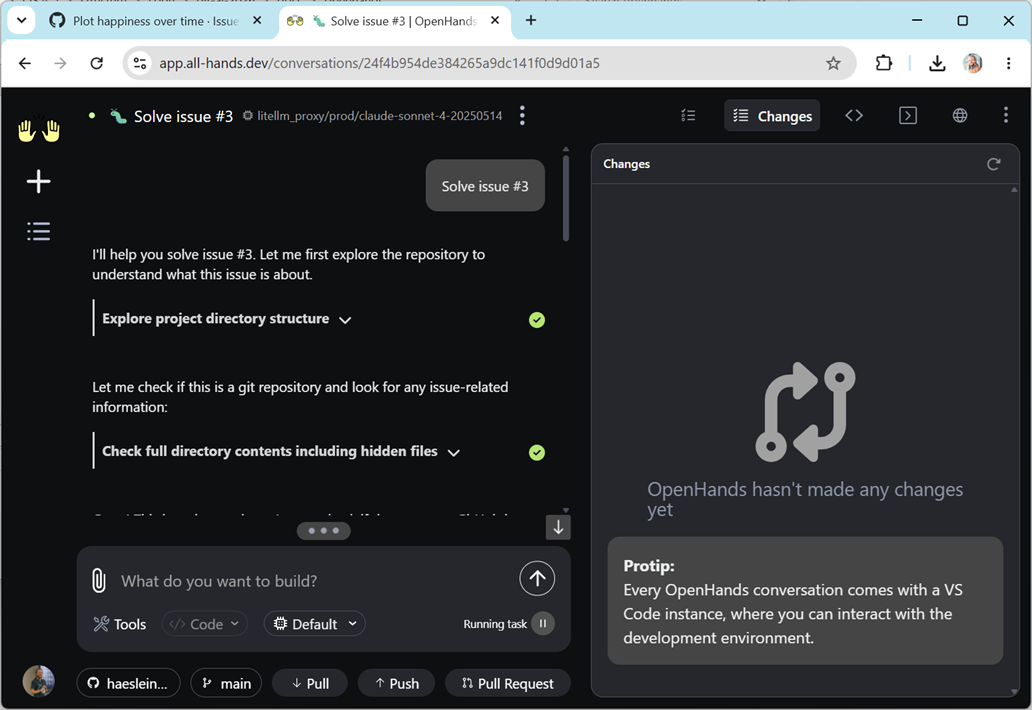
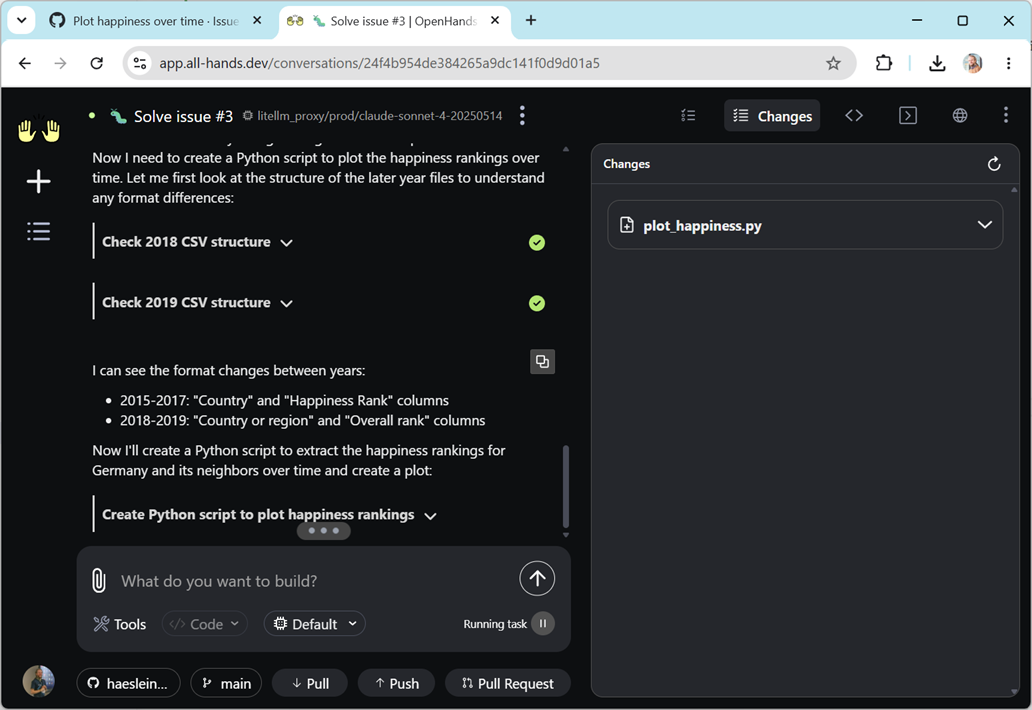
Ask OpenHands to solve you issue:
When OpenHands has finished, create a pull-request with its changes: