Taxi Trips (solution)#
%%bash
mkdir -p ~/.local/share/jupyter/kernels/ai4seismology-bigdata
cp /data/horse/ws/s4122485-ai4seismology_dev/thursday_bigdata/kernel.json ~/.local/share/jupyter/kernels/ai4seismology-bigdata
Select ai4seismology-bigdata kernel#
import sys
!{sys.executable} -m pip install --user --upgrade ipympl jupyter_leaflet leafmap ipyleaflet
Restart the Jupyter Server#
# To enable horizontal scrolling
from IPython.display import display, HTML
display(HTML("<style>pre { white-space: pre !important; }</style>"))
Initialisation of Spark cluster#
# Note: Skip if running on local machine
# Import utilities required to run big data frameworks on ZIH HPC systems
from big_data_utils.environment_utils import ClusterConfig
from big_data_utils.cluster_utils import ClusterService
from big_data_utils.utils import kill_java_processes_by_name
# Note: Skip if running on local machine
# Configure the cluster environment
myconfig = ClusterConfig(fw_name="spark")
#myconfig.configure_env(conf_dest="./my-conf", conf_template="/projects/p_scads_bigdatahpc/.template/spark")
myconfig.configure_env(conf_dest="./my-conf",randomize_ports=True)
[INFO ] [08/05/2025 11:11:45] - Removing existing configuration directory: './my-conf'
[INFO ] [08/05/2025 11:11:45] - Environment configuration initialized:
[INFO ] [08/05/2025 11:11:45] -   • Framework:        SPARK
[INFO ] [08/05/2025 11:11:45] -   • Config template:  /software/rapids/r24.04/Spark/3.5.0-GCC-13.2.0-hadoop3/conf
[INFO ] [08/05/2025 11:11:45] -   • Config target:    ./my-conf
[INFO ] [08/05/2025 11:11:45] -   • Log directory:    ./my-conf/log
[INFO ] [08/05/2025 11:11:45] - Initializing configuration from template.
[INFO ] [08/05/2025 11:11:47] - Cluster topology:
[INFO ] [08/05/2025 11:11:47] -   • Master node:  n1498:7676
[INFO ] [08/05/2025 11:11:47] -   • Worker nodes: n1498
[INFO ] [08/05/2025 11:11:48] -   • Spark master URL: spark://n1498:7676
[INFO ] [08/05/2025 11:11:48] - Once the cluster is started, one can access the spark GUI in browser using port forwarding.
[INFO ] [08/05/2025 11:11:48] - To access, spark GUI, type following in your terminal on local machine:
[INFO ] [08/05/2025 11:11:48] -   ssh s4122485@login1.barnard.hpc.tu-dresden.de -L 4040:n1498:4040 -L 8080:n1498:8080 -L 8081:n1498:8081
[INFO ] [08/05/2025 11:11:48] - Once the port is forwarded, one can access the GUI, by accessing
[INFO ] [08/05/2025 11:11:48] -   • http://localhost:4040
[INFO ] [08/05/2025 11:11:48] -   • http://localhost:8080
[INFO ] [08/05/2025 11:11:48] -   • http://localhost:8081
# Initialize the cluster service class
mycluster = ClusterService("spark")

# Check which processes are running
mycluster.check_status()
[INFO ] [08/05/2025 11:11:49] - Currently, following java processes are running:
[INFO ] [08/05/2025 11:11:50] - 	Process ID, Name
# Note: Skip if running on local machine
# Start Spark standalone cluster
mycluster.start_cluster()
[INFO ] [08/05/2025 11:11:51] - Starting SPARK cluster.
[INFO ] [08/05/2025 11:11:57] - Logging cluster startup info at: ./my-conf/spark/log/cluster.log

----Performance Data----
Duration: 5.53

CPU Util (Across CPUs)       	AVG: 17.06	 MIN: 0.00	 MAX: 100.00
Mem Util in GB (Across nodes)	AVG: 218.53	 MIN: 218.43	 MAX: 218.63
IO Ops (excl.) Read          	Total: 30261
               Write         	Total: 3776
IO Bytes (excl.) Read        	Total: 55.62
                 Write       	Total: 0.61
# Note: Skip if running on local machine
# Check if the master and worker processes are started or not
mycluster.check_status()
[INFO ] [08/05/2025 11:11:58] - Currently, following java processes are running:
[INFO ] [08/05/2025 11:11:58] - 	Process ID, Name
[INFO ] [08/05/2025 11:11:58] - 	387396, Master
[INFO ] [08/05/2025 11:11:58] - 	387464, Worker
Download of NYC taxi trips and taxi zone file#
Modify the base directory in the following cell if you want to save data files in different directories.
base_directory = "./data"
import os
import wget
import zipfile

base_directory = os.path.abspath(base_directory)
os.environ["BASEDIRECTORY"] = base_directory

# Download yellow trip data
data_directory = base_directory + "/taxidata"
data_file = "yellow_tripdata_2022-01.parquet"
data_path = data_directory + "/" + data_file
if not os.path.exists(data_path):
    os.makedirs(data_directory, exist_ok=True)
if not os.path.exists(data_path):
    wget.download("https://d37ci6vzurychx.cloudfront.net/trip-data/" + data_file, out = data_directory)

# Download zone data
zone_directory = base_directory + "/taxizonesdata"
if not os.path.isdir(zone_directory):
    os.makedirs(zone_directory, exist_ok=True)

zone_zipfile = "taxi_zones.zip"
zone_zipfile_path = zone_directory + "/" + zone_zipfile
if not os.path.exists(zone_zipfile_path):
    wget.download("https://d37ci6vzurychx.cloudfront.net/misc/" + zone_zipfile, out = zone_directory)
    with zipfile.ZipFile(zone_zipfile_path, "r") as zip_ref:
        zip_ref.extractall(zone_directory)
        zip_ref.close()

zone_lookup_file = "taxi_zone_lookup.csv"
if not os.path.exists(zone_directory + "/" + zone_lookup_file):
    wget.download("https://d37ci6vzurychx.cloudfront.net/misc/" + zone_lookup_file, out = zone_directory)
Initialisation of Spark context#
import findspark
import os
findspark.init(os.environ['SPARK_HOME'])
print(os.environ['SPARK_HOME'])
/software/rapids/r24.04/Spark/3.5.0-GCC-13.2.0-hadoop3
import platform
import pyspark
from pyspark import SparkContext
from pyspark.sql import SparkSession

spark = SparkSession.builder \
    .master(f"spark://{myconfig.get_master_host()}:{myconfig.get_master_port()}") \
    .appName("Python Spark Map Visualization of NYC taxi trips") \
    .getOrCreate()

sc = spark.sparkContext
Setting default log level to "WARN".
To adjust logging level use sc.setLogLevel(newLevel). For SparkR, use setLogLevel(newLevel).
25/05/08 11:12:06 WARN NativeCodeLoader: Unable to load native-hadoop library for your platform... using builtin-java classes where applicable
----Performance Data----
Duration: 6.21

CPU Util (Across CPUs)       	AVG: 16.10	 MIN: 0.00	 MAX: 66.20
Mem Util in GB (Across nodes)	AVG: 219.03	 MIN: 218.94	 MAX: 219.14
IO Ops (excl.) Read          	Total: 32456
               Write         	Total: 3940
IO Bytes (excl.) Read        	Total: 86.50
                 Write       	Total: 0.77
# Check running java processes
mycluster.check_status()
[INFO ] [08/05/2025 11:12:09] - Currently, following java processes are running:
[INFO ] [08/05/2025 11:12:10] - 	Process ID, Name
[INFO ] [08/05/2025 11:12:10] - 	387621, SparkSubmit
[INFO ] [08/05/2025 11:12:10] - 	387396, Master
[INFO ] [08/05/2025 11:12:10] - 	387725, CoarseGrainedExecutorBackend
[INFO ] [08/05/2025 11:12:10] - 	387464, Worker
trips = spark.read.parquet(base_directory + "/taxidata/yellow_tripdata_2022-01.parquet")
----Performance Data----
Duration: 5.29

CPU Util (Across CPUs)       	AVG: 18.45	 MIN: 0.00	 MAX: 52.80
Mem Util in GB (Across nodes)	AVG: 220.96	 MIN: 219.65	 MAX: 221.68
IO Ops (excl.) Read          	Total: 34439
               Write         	Total: 4027
IO Bytes (excl.) Read        	Total: 86.53
                 Write       	Total: 0.83
trips.dtypes
[('VendorID', 'bigint'),
 ('tpep_pickup_datetime', 'timestamp_ntz'),
 ('tpep_dropoff_datetime', 'timestamp_ntz'),
 ('passenger_count', 'double'),
 ('trip_distance', 'double'),
 ('RatecodeID', 'double'),
 ('store_and_fwd_flag', 'string'),
 ('PULocationID', 'bigint'),
 ('DOLocationID', 'bigint'),
 ('payment_type', 'bigint'),
 ('fare_amount', 'double'),
 ('extra', 'double'),
 ('mta_tax', 'double'),
 ('tip_amount', 'double'),
 ('tolls_amount', 'double'),
 ('improvement_surcharge', 'double'),
 ('total_amount', 'double'),
 ('congestion_surcharge', 'double'),
 ('airport_fee', 'double')]
trips.show()
+--------+--------------------+---------------------+---------------+-------------+----------+------------------+------------+------------+------------+-----------+-----+-------+----------+------------+---------------------+------------+--------------------+-----------+
|VendorID|tpep_pickup_datetime|tpep_dropoff_datetime|passenger_count|trip_distance|RatecodeID|store_and_fwd_flag|PULocationID|DOLocationID|payment_type|fare_amount|extra|mta_tax|tip_amount|tolls_amount|improvement_surcharge|total_amount|congestion_surcharge|airport_fee|
+--------+--------------------+---------------------+---------------+-------------+----------+------------------+------------+------------+------------+-----------+-----+-------+----------+------------+---------------------+------------+--------------------+-----------+
|       1| 2022-01-01 00:35:40|  2022-01-01 00:53:29|            2.0|          3.8|       1.0|                 N|         142|         236|           1|       14.5|  3.0|    0.5|      3.65|         0.0|                  0.3|       21.95|                 2.5|        0.0|
|       1| 2022-01-01 00:33:43|  2022-01-01 00:42:07|            1.0|          2.1|       1.0|                 N|         236|          42|           1|        8.0|  0.5|    0.5|       4.0|         0.0|                  0.3|        13.3|                 0.0|        0.0|
|       2| 2022-01-01 00:53:21|  2022-01-01 01:02:19|            1.0|         0.97|       1.0|                 N|         166|         166|           1|        7.5|  0.5|    0.5|      1.76|         0.0|                  0.3|       10.56|                 0.0|        0.0|
|       2| 2022-01-01 00:25:21|  2022-01-01 00:35:23|            1.0|         1.09|       1.0|                 N|         114|          68|           2|        8.0|  0.5|    0.5|       0.0|         0.0|                  0.3|        11.8|                 2.5|        0.0|
|       2| 2022-01-01 00:36:48|  2022-01-01 01:14:20|            1.0|          4.3|       1.0|                 N|          68|         163|           1|       23.5|  0.5|    0.5|       3.0|         0.0|                  0.3|        30.3|                 2.5|        0.0|
|       1| 2022-01-01 00:40:15|  2022-01-01 01:09:48|            1.0|         10.3|       1.0|                 N|         138|         161|           1|       33.0|  3.0|    0.5|      13.0|        6.55|                  0.3|       56.35|                 2.5|        0.0|
|       2| 2022-01-01 00:20:50|  2022-01-01 00:34:58|            1.0|         5.07|       1.0|                 N|         233|          87|           1|       17.0|  0.5|    0.5|       5.2|         0.0|                  0.3|        26.0|                 2.5|        0.0|
|       2| 2022-01-01 00:13:04|  2022-01-01 00:22:45|            1.0|         2.02|       1.0|                 N|         238|         152|           2|        9.0|  0.5|    0.5|       0.0|         0.0|                  0.3|        12.8|                 2.5|        0.0|
|       2| 2022-01-01 00:30:02|  2022-01-01 00:44:49|            1.0|         2.71|       1.0|                 N|         166|         236|           1|       12.0|  0.5|    0.5|      2.25|         0.0|                  0.3|       18.05|                 2.5|        0.0|
|       2| 2022-01-01 00:48:52|  2022-01-01 00:53:28|            1.0|         0.78|       1.0|                 N|         236|         141|           2|        5.0|  0.5|    0.5|       0.0|         0.0|                  0.3|         8.8|                 2.5|        0.0|
|       2| 2022-01-01 00:55:03|  2022-01-01 01:04:25|            1.0|         1.91|       1.0|                 N|         141|         229|           2|        8.5|  0.5|    0.5|       0.0|         0.0|                  0.3|        12.3|                 2.5|        0.0|
|       2| 2022-01-01 00:31:06|  2022-01-01 00:34:14|            3.0|         0.82|       1.0|                 N|         114|          90|           2|        4.5|  0.5|    0.5|       0.0|         0.0|                  0.3|         8.3|                 2.5|        0.0|
|       2| 2022-01-01 00:41:07|  2022-01-01 00:44:46|            3.0|         0.73|       1.0|                 N|         234|         113|           2|        4.5|  0.5|    0.5|       0.0|         0.0|                  0.3|         8.3|                 2.5|        0.0|
|       2| 2022-01-01 00:56:34|  2022-01-01 01:12:04|            2.0|         2.16|       1.0|                 N|         246|          79|           1|       11.5|  0.5|    0.5|      3.06|         0.0|                  0.3|       18.36|                 2.5|        0.0|
|       2| 2022-01-01 00:39:46|  2022-01-01 00:47:36|            4.0|         1.43|       1.0|                 N|          43|         140|           1|        7.5|  0.5|    0.5|      2.26|         0.0|                  0.3|       13.56|                 2.5|        0.0|
|       2| 2022-01-01 00:58:06|  2022-01-01 01:05:45|            1.0|         1.58|       1.0|                 N|         239|         151|           2|        8.0|  0.5|    0.5|       0.0|         0.0|                  0.3|        11.8|                 2.5|        0.0|
|       1| 2022-01-01 00:33:52|  2022-01-01 00:47:28|            3.0|          4.2|       1.0|                 N|         148|         141|           1|       14.0|  2.5|    0.5|      3.45|         0.0|                  0.3|       20.75|                 2.5|        0.0|
|       1| 2022-01-01 00:53:54|  2022-01-01 01:05:20|            2.0|          2.2|       1.0|                 N|         237|         107|           1|        9.5|  2.5|    0.5|      2.55|         0.0|                  0.3|       15.35|                 2.5|        0.0|
|       1| 2022-01-01 00:00:44|  2022-01-01 00:05:29|            1.0|          0.2|       1.0|                 N|           7|           7|           2|        5.0|  0.5|    0.5|       0.0|         0.0|                  0.3|         6.3|                 0.0|        0.0|
|       1| 2022-01-01 00:35:50|  2022-01-01 00:48:33|            2.0|          3.9|       1.0|                 N|         107|         263|           1|       13.0|  3.0|    0.5|      3.35|         0.0|                  0.3|       20.15|                 2.5|        0.0|
+--------+--------------------+---------------------+---------------+-------------+----------+------------------+------------+------------+------------+-----------+-----+-------+----------+------------+---------------------+------------+--------------------+-----------+
only showing top 20 rows


----Performance Data----
Duration: 5.69

CPU Util (Across CPUs)       	AVG: 23.49	 MIN: 0.00	 MAX: 75.00
Mem Util in GB (Across nodes)	AVG: 219.78	 MIN: 219.70	 MAX: 219.86
IO Ops (excl.) Read          	Total: 34755
               Write         	Total: 4097
IO Bytes (excl.) Read        	Total: 86.56
                 Write       	Total: 0.89
Grouping using groupBy#
# using groupBy
trips.groupBy("VendorID").count().show()
+--------+-------+
|VendorID|  count|
+--------+-------+
|       6|   5563|
|       5|     36|
|       1| 742273|
|       2|1716059|
+--------+-------+
Exercise 1#
Count trips grouped by passengers.
Are there unexpected values? How can they be interpreted? Find more information on https://www1.nyc.gov/site/tlc/about/tlc-trip-record-data.page.
trips.groupBy("passenger_count").count().show() #add something here
+---------------+-------+
|passenger_count|  count|
+---------------+-------+
|            8.0|      8|
|            0.0|  52061|
|            7.0|      9|
|           NULL|  71503|
|            1.0|1794055|
|            4.0|  35321|
|            3.0|  84570|
|            2.0| 343026|
|            6.0|  32037|
|            5.0|  51338|
|            9.0|      3|
+---------------+-------+
Exercise 2#
Find the minimal distance for these groups. Are there unexpected values? How can they be interpreted?
trips.groupBy("passenger_count").min("trip_distance").show() #add something here
+---------------+------------------+
|passenger_count|min(trip_distance)|
+---------------+------------------+
|            8.0|               0.0|
|            0.0|               0.0|
|            7.0|               0.0|
|           NULL|               0.0|
|            1.0|               0.0|
|            4.0|               0.0|
|            3.0|               0.0|
|            2.0|               0.0|
|            6.0|               0.0|
|            5.0|               0.0|
|            9.0|               0.0|
+---------------+------------------+
Exercise 3#
Remove all trip distances of 0.0 miles from the previous result. What do you expect?
trips.filter(trips.trip_distance > 0.0).groupby("passenger_count").min("trip_distance").show() #add something here
+---------------+------------------+
|passenger_count|min(trip_distance)|
+---------------+------------------+
|            8.0|              4.09|
|            0.0|              0.01|
|            7.0|              0.32|
|           NULL|              0.01|
|            1.0|              0.01|
|            4.0|              0.01|
|            3.0|              0.01|
|            2.0|              0.01|
|            6.0|              0.01|
|            5.0|              0.01|
|            9.0|              0.12|
+---------------+------------------+
SQL Queries#
from pyspark.sql.types import *

sqlContext = SparkSession.builder.getOrCreate()
# Create a temporary view from the DataFrame
trips.createOrReplaceTempView("trips")
# Apply a SQL query
query = "SELECT fare_amount FROM trips WHERE trip_distance>=5"
sqlContext.sql(query).show()
+-----------+
|fare_amount|
+-----------+
|       33.0|
|       17.0|
|       20.0|
|       34.5|
|       21.0|
|       16.0|
|       18.5|
|       52.0|
|       52.0|
|       19.5|
|       23.5|
|       52.0|
|       52.0|
|       24.5|
|       21.5|
|       52.0|
|       19.0|
|       33.0|
|       45.5|
|       20.5|
+-----------+
only showing top 20 rows
Exercise 4#
Rewrite the previous statement without SQL, but with a functional statement.
trips.filter(trips.trip_distance > 5).select("fare_amount").show() # add something here
+-----------+
|fare_amount|
+-----------+
|       33.0|
|       17.0|
|       20.0|
|       34.5|
|       21.0|
|       16.0|
|       18.5|
|       52.0|
|       52.0|
|       19.5|
|       23.5|
|       52.0|
|       52.0|
|       24.5|
|       21.5|
|       52.0|
|       19.0|
|       33.0|
|       45.5|
|       20.5|
+-----------+
only showing top 20 rows
#compute summary statistics
trips.describe().show()
25/05/08 11:12:38 WARN SparkStringUtils: Truncated the string representation of a plan since it was too large. This behavior can be adjusted by setting 'spark.sql.debug.maxToStringFields'.
+-------+------------------+------------------+-----------------+------------------+------------------+------------------+------------------+------------------+------------------+------------------+-------------------+------------------+------------------+---------------------+-----------------+--------------------+-------------------+
|summary|          VendorID|   passenger_count|    trip_distance|        RatecodeID|store_and_fwd_flag|      PULocationID|      DOLocationID|      payment_type|       fare_amount|             extra|            mta_tax|        tip_amount|      tolls_amount|improvement_surcharge|     total_amount|congestion_surcharge|        airport_fee|
+-------+------------------+------------------+-----------------+------------------+------------------+------------------+------------------+------------------+------------------+------------------+-------------------+------------------+------------------+---------------------+-----------------+--------------------+-------------------+
|  count|           2463931|           2392428|          2463931|           2392428|           2392428|           2463931|           2463931|           2463931|           2463931|           2463931|            2463931|           2463931|           2463931|              2463931|          2463931|             2392428|            2392428|
|   mean| 1.707819334226486|1.3894533085217193| 5.37275119311366|1.4155067571521485|              NULL|166.07680937493785|163.58071553140084| 1.194449032866586|12.946484016795376|1.0067101432629406| 0.4914538921747404|2.3856955409873013|0.3749772660037505|   0.2967234066285709|19.16937009586583|   2.282322498315519|0.08249934794275941|
| stddev|0.5021374727297668|0.9829685911276145|547.8714044600813| 5.917573265219833|              NULL| 65.46805744761048|  70.7901589008199|0.5001778217730759| 255.8148866371484|1.2362260656700204|0.08291560479693483| 2.830697971100425|1.6805380158244452| 0.043747407377596345|255.9640887564706|  0.7432039804760115| 0.3125554417761857|
|    min|                 1|               0.0|              0.0|               1.0|                 N|                 1|                 1|                 0|            -480.0|              -4.5|               -0.5|           -125.22|             -31.4|                 -0.3|           -480.3|                -2.5|              -1.25|
|    max|                 6|               9.0|        306159.28|              99.0|                 Y|               265|               265|                 5|         401092.32|              33.5|              16.59|            888.88|             193.3|                  0.3|        401095.62|                 2.5|               1.25|
+-------+------------------+------------------+-----------------+------------------+------------------+------------------+------------------+------------------+------------------+------------------+-------------------+------------------+------------------+---------------------+-----------------+--------------------+-------------------+


----Performance Data----
Duration: 20.00

CPU Util (Across CPUs)       	AVG: 22.94	 MIN: 0.00	 MAX: 100.00
Mem Util in GB (Across nodes)	AVG: 220.76	 MIN: 220.36	 MAX: 223.14
IO Ops (excl.) Read          	Total: 36317
               Write         	Total: 4374
IO Bytes (excl.) Read        	Total: 86.70
                 Write       	Total: 1.19
Exercise 5#
Find the distance for tips larger than $5 - Formulate a SQL query and apply it on the DataFrame.
query =  "SELECT trip_distance FROM trips WHERE fare_amount>5"# add something here
sqlContext.sql(query).show()
+-------------+
|trip_distance|
+-------------+
|          3.8|
|          2.1|
|         0.97|
|         1.09|
|          4.3|
|         10.3|
|         5.07|
|         2.02|
|         2.71|
|         1.91|
|         2.16|
|         1.43|
|         1.58|
|          4.2|
|          2.2|
|          3.9|
|          3.2|
|          1.2|
|          1.7|
|          1.6|
+-------------+
only showing top 20 rows
Exercise 6#
Formulate a query to get sum of total amount of trip for distances larger than 30 miles.
query = "SELECT SUM(total_amount) FROM trips WHERE trip_distance>30" # add something here
sqlContext.sql(query).show()
+------------------+
| sum(total_amount)|
+------------------+
|273382.60999999923|
+------------------+
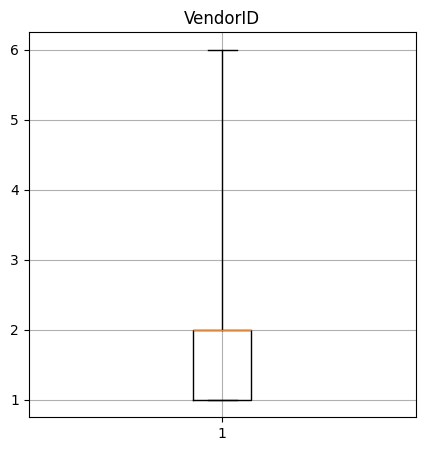
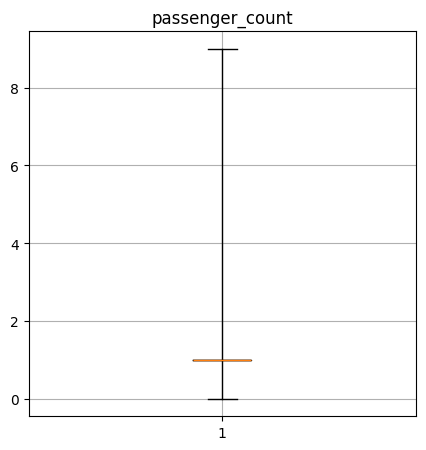
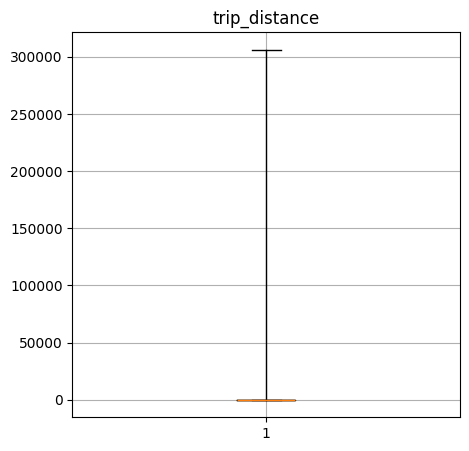
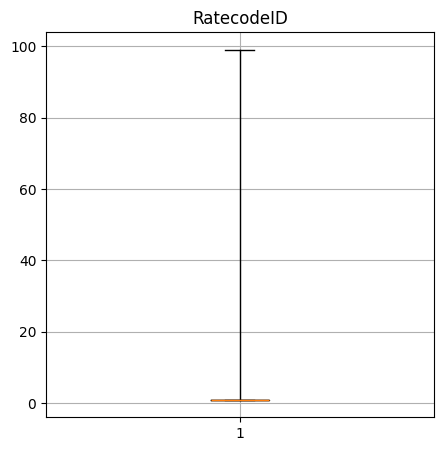
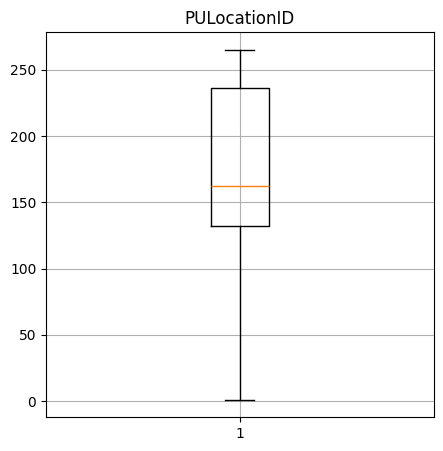
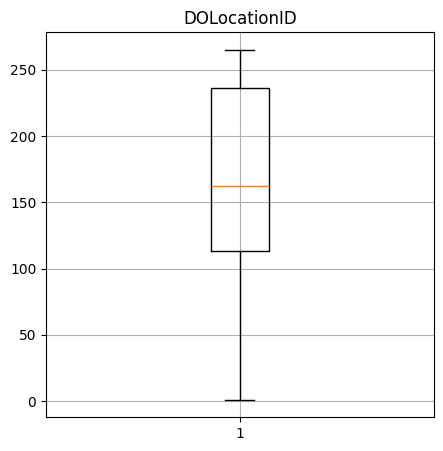
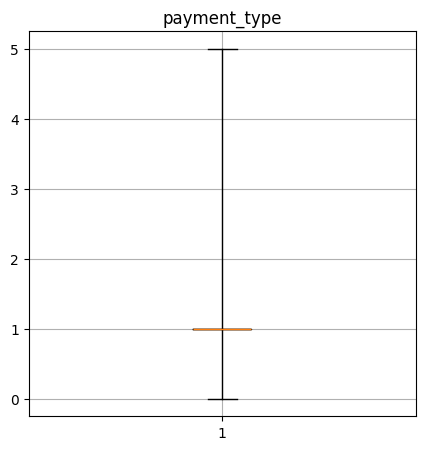
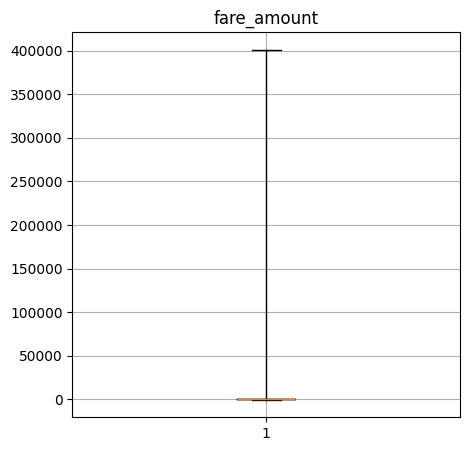
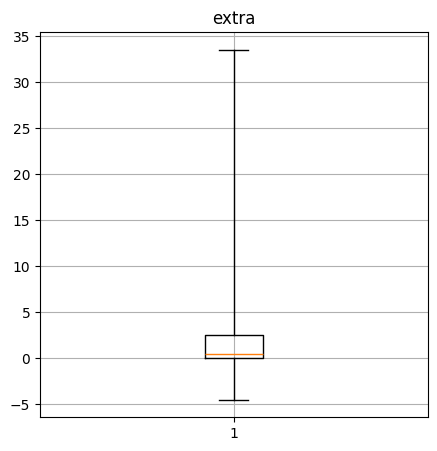
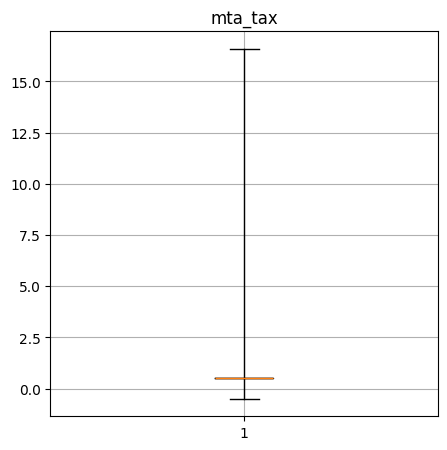
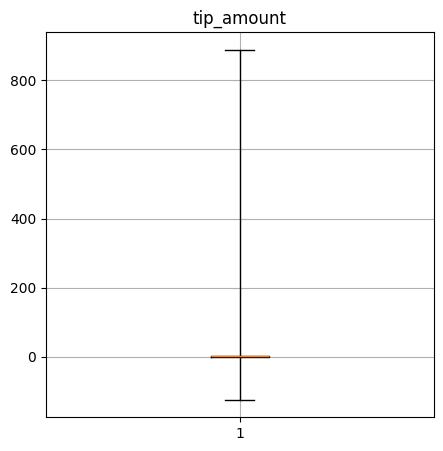
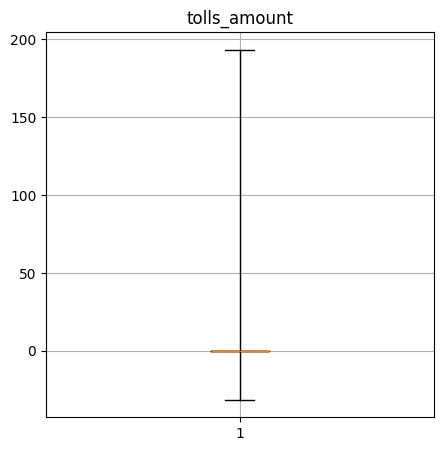
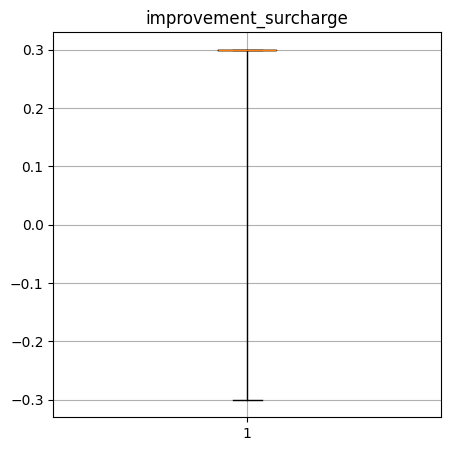
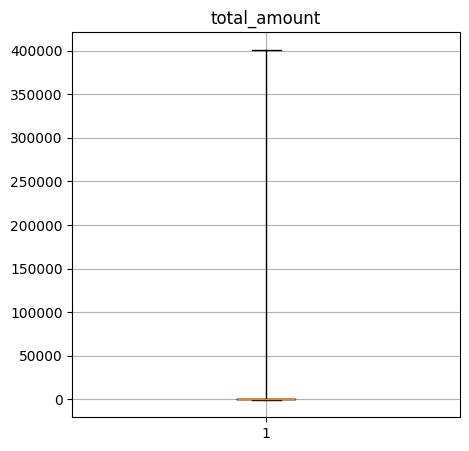
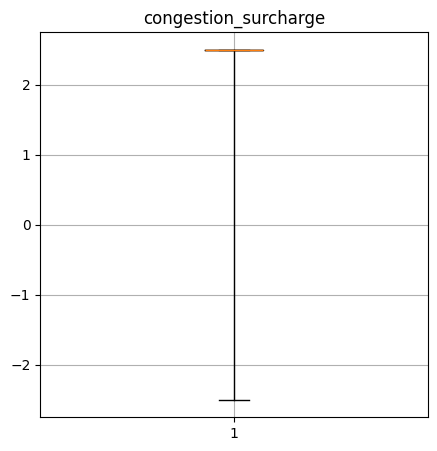
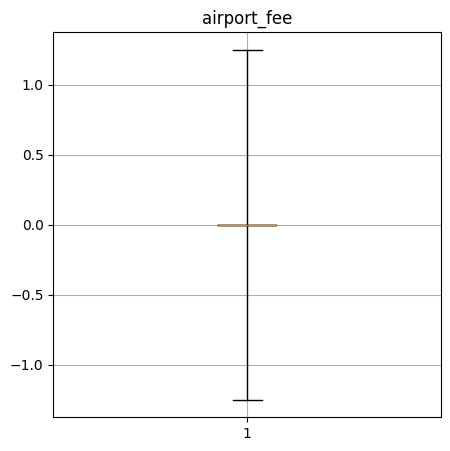
Exercise 7#
Create a box-and-whisker plot of the numerical columns. What do these say about the data?
%matplotlib inline
import matplotlib.pyplot as plt
for column in trips.dtypes:
    name = column[0]
    colType = column[1]
    if colType != 'string' and colType != 'timestamp' and colType != 'timestamp_ntz':
        columnQuantiles = trips.approxQuantile(col=name,probabilities=[0.0,0.25,0.50,0.75,1.00],relativeError=0.01) # add something here
        print("{} quantiles: {}".format(name,columnQuantiles))
        stats = [{
            "whislo": columnQuantiles[0], # add something here
            "q1": columnQuantiles[1], # add something here
            "med": columnQuantiles[2], # add something here
            "q3": columnQuantiles[3], # add something here
            "whishi": columnQuantiles[4], # add something here
        }]
        fig, axes = plt.subplots(nrows=1, ncols=1, figsize=(5,5), sharey=True)
        axes.bxp(bxpstats=stats, showfliers=False)
        axes.grid(True)
        axes.set_title(name)
VendorID quantiles: [1.0, 1.0, 2.0, 2.0, 6.0]
passenger_count quantiles: [0.0, 1.0, 1.0, 1.0, 9.0]
trip_distance quantiles: [0.0, 1.06, 1.74, 3.16, 306159.28]
RatecodeID quantiles: [1.0, 1.0, 1.0, 1.0, 99.0]
PULocationID quantiles: [1.0, 132.0, 162.0, 236.0, 265.0]
DOLocationID quantiles: [1.0, 113.0, 162.0, 236.0, 265.0]
payment_type quantiles: [0.0, 1.0, 1.0, 1.0, 5.0]
fare_amount quantiles: [-480.0, 6.5, 9.0, 14.0, 401092.32]
extra quantiles: [-4.5, 0.0, 0.5, 2.5, 33.5]
mta_tax quantiles: [-0.5, 0.5, 0.5, 0.5, 16.59]
tip_amount quantiles: [-125.22, 0.08, 2.0, 3.0, 888.88]
tolls_amount quantiles: [-31.4, 0.0, 0.0, 0.0, 193.3]
improvement_surcharge quantiles: [-0.3, 0.3, 0.3, 0.3, 0.3]
total_amount quantiles: [-480.3, 11.3, 14.55, 20.16, 401095.62]
congestion_surcharge quantiles: [-2.5, 2.5, 2.5, 2.5, 2.5]
airport_fee quantiles: [-1.25, 0.0, 0.0, 0.0, 1.25]
----Performance Data----
Duration: 15.90

CPU Util (Across CPUs)       	AVG: 30.01	 MIN: 4.00	 MAX: 100.00
Mem Util in GB (Across nodes)	AVG: 221.15	 MIN: 220.59	 MAX: 222.70
IO Ops (excl.) Read          	Total: 37208
               Write         	Total: 4655
IO Bytes (excl.) Read        	Total: 86.78
                 Write       	Total: 1.35
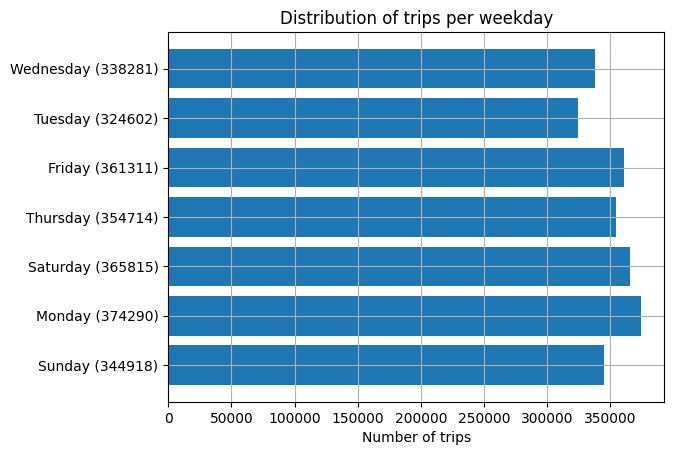
Exercise 8#
Provide an overview over the number of trips per week day.
def barchart(dataRows, titleSuffix):
    positions = list(reversed(range(len(dataRows))))
    names = [str(item[titleSuffix]) + " (" + str(item['count']) + ")" for item in dataRows]
    values = [item['count'] for item in dataRows]
    plt.grid()
    plt.barh(positions,values,align="center")
    plt.yticks(positions,names)
    plt.xlabel("Number of trips")
    plt.title("Distribution of trips per " + titleSuffix)
    plt.show()
import datetime
help(datetime.datetime.weekday)
Help on method_descriptor:

weekday(...)
    Return the day of the week represented by the date.
    Monday == 0 ... Sunday == 6
from pyspark.sql.functions import udf
from pyspark.sql.functions import col
from pyspark.sql.types import IntegerType
import calendar

#udf stands for user defined function
@udf
def weekdayStr(d):
    return calendar.day_name[d.weekday()] # add something here

@udf(returnType=IntegerType())
def weekday(d):
    return d.weekday()

#Replace function weekday with function weekdayStr if you want.
weekdayRows = trips.select(weekdayStr(trips.tpep_dropoff_datetime).alias("weekday")).groupby("weekday").count().collect() # add something here

barchart(weekdayRows, "weekday")
----Performance Data----
Duration: 21.06

CPU Util (Across CPUs)       	AVG: 16.00	 MIN: 0.00	 MAX: 100.00
Mem Util in GB (Across nodes)	AVG: 221.70	 MIN: 220.72	 MAX: 223.88
IO Ops (excl.) Read          	Total: 39851
               Write         	Total: 4822
IO Bytes (excl.) Read        	Total: 91.58
                 Write       	Total: 1.45
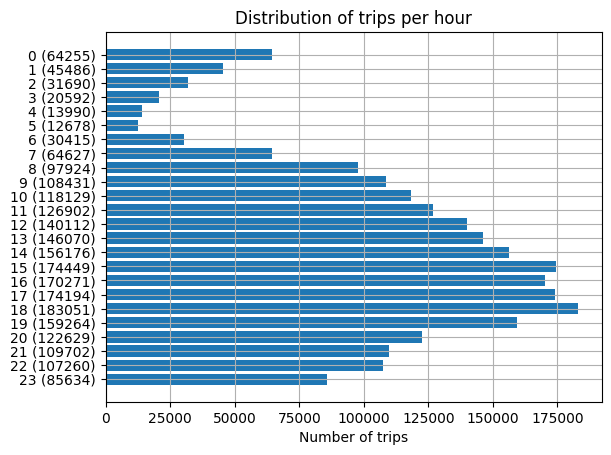
Exercise 9#
Provide an overview over the number of trips per hour.
@udf(returnType=IntegerType())
def hour(d):
    return d.hour

hourRows = sorted(trips.select(hour(trips.tpep_dropoff_datetime).alias("hour")).groupby("hour").count().collect())# add something here

barchart(hourRows, "hour")
----Performance Data----
Duration: 11.59

CPU Util (Across CPUs)       	AVG: 25.43	 MIN: 0.00	 MAX: 100.00
Mem Util in GB (Across nodes)	AVG: 221.26	 MIN: 221.07	 MAX: 221.98
IO Ops (excl.) Read          	Total: 46157
               Write         	Total: 4923
IO Bytes (excl.) Read        	Total: 91.60
                 Write       	Total: 1.49
Map Visualisations#
import leafmap
def getMap():
    map_args={
        "google_map":"HYBRID",
        #center to New York at 41 degrees north and 74 degrees west ([lat, lon])
        "center":[40.702557, -74.012318],
        "zoom":12,
        "height":"450px",
        "width":"800px",
        "max_zoom":"20"
    }
    return leafmap.Map(**map_args)
getMap()
def taxizoneColorFunction(taxiZonesIntensity, maximum_intensity, taxizoneFeature):
    taxizoneId = taxizoneFeature["properties"]["LocationID"]
    taxizoneIntensity = taxiZonesIntensity[taxizoneId] if taxizoneId in taxiZonesIntensity else 0
    return {
        "color": "black",
        "fillColor": '#%02X0000' % (int(taxizoneIntensity*255/maximum_intensity))
    }
def getTaxiZoneStylingFunction(taxiZonesIntensity):
    maximum_intensity = max(taxiZonesIntensity.values())
    return lambda x: taxizoneColorFunction(taxiZonesIntensity, maximum_intensity, x)
taxizonesFile = base_directory+"/taxizonesdata/taxi_zones.shp" ############# has only zones till 263

def getZoneCenters():
    zone_centers={}
    my_geojson = leafmap.shp_to_geojson(taxizonesFile)

    for feature in my_geojson["features"]:
        location = feature["properties"]["LocationID"]
        coordinates = feature["geometry"]["coordinates"]

        avg_lat = 0
        avg_lon = 0
        count = 0
        for coordinate_list in coordinates:
            for coordinate in coordinate_list:
                if type(coordinate) == tuple and len(coordinate) == 2: #############
                    avg_lat += coordinate[1]
                    avg_lon += coordinate[0]
                    count += 1
                elif len(coordinate) > 2:
                    for coord in coordinate:
                        avg_lat += coord[1]
                        avg_lon += coord[0]
                        count += 1
                elif len(coordinate) < 2: #############
                    print(coordinate)
        avg_lat = avg_lat/count
        avg_lon = avg_lon/count
        zone_centers[location]=[avg_lat, avg_lon]
    return zone_centers

zoneCenters = getZoneCenters()
def getHeatCenters(taxizoneIntensityMap):
    heat_data=[]
    for key, value in zoneCenters.items():
        location = key
        (lat, lon) = value
        taxizoneIntensity = taxizoneIntensityMap[location] if location in taxizoneIntensityMap else 0
        heat_data.append([lat, lon, taxizoneIntensity])
    return heat_data
Exercise 10#
Get the number of trips which start/end in each zone.
pickupData = trips.groupBy("PULocationID").count().sort("PULocationID").collect() #add something here
dropoffData = trips.groupBy("DOLocationID").count().sort("DOLocationID").collect() #add something here
grouped_by_pickup_location={row["PULocationID"]:row["count"] for row in pickupData}
grouped_by_dropoff_location={row["DOLocationID"]:row["count"] for row in dropoffData}
m = getMap()
m.add_shp(in_shp=taxizonesFile,layer_name="taxizone",style={},hover_style={}, style_callback=getTaxiZoneStylingFunction(grouped_by_pickup_location), fill_colors=None,
              info_mode='on_hover')
m.layer_opacity('taxizone', 0.9)
m.add_heatmap(data=getHeatCenters(grouped_by_pickup_location), name='pickup_heat', radius=10)
m.layer_opacity('pickup_heat', 0.9)
m
m = getMap()
m.add_shp(in_shp=taxizonesFile,layer_name="taxizone",style={},hover_style={}, style_callback=getTaxiZoneStylingFunction(grouped_by_dropoff_location), fill_colors=None,
              info_mode='on_hover')
m.layer_opacity('taxizone', 0.9)
m.add_heatmap(data=getHeatCenters(grouped_by_dropoff_location), name='dropoff_heat', radius=10)
m.layer_opacity('dropoff_heat', 0.9)
m
Exercise 11#
Collect the trips with the 10 highest tips. Be careful not to use trips with zones which indicate “Unknown” or N/Avalues.
import pyspark.sql.functions as F
zoneLookup = spark.read.csv(base_directory + "/taxizonesdata/taxi_zone_lookup.csv", header=True, inferSchema=True)
zoneLookup.filter(zoneLookup.Borough == "Unknown").show()
zoneLookup.filter(zoneLookup.Borough == "N/A").show()
+----------+-------+----+------------+
|LocationID|Borough|Zone|service_zone|
+----------+-------+----+------------+
|       264|Unknown| N/A|         N/A|
+----------+-------+----+------------+

+----------+-------+--------------+------------+
|LocationID|Borough|          Zone|service_zone|
+----------+-------+--------------+------------+
|       265|    N/A|Outside of NYC|         N/A|
+----------+-------+--------------+------------+
zoneLookup.dtypes
[('LocationID', 'int'),
 ('Borough', 'string'),
 ('Zone', 'string'),
 ('service_zone', 'string')]
trips.dtypes
[('VendorID', 'bigint'),
 ('tpep_pickup_datetime', 'timestamp_ntz'),
 ('tpep_dropoff_datetime', 'timestamp_ntz'),
 ('passenger_count', 'double'),
 ('trip_distance', 'double'),
 ('RatecodeID', 'double'),
 ('store_and_fwd_flag', 'string'),
 ('PULocationID', 'bigint'),
 ('DOLocationID', 'bigint'),
 ('payment_type', 'bigint'),
 ('fare_amount', 'double'),
 ('extra', 'double'),
 ('mta_tax', 'double'),
 ('tip_amount', 'double'),
 ('tolls_amount', 'double'),
 ('improvement_surcharge', 'double'),
 ('total_amount', 'double'),
 ('congestion_surcharge', 'double'),
 ('airport_fee', 'double')]
help(trips.join)
Help on method join in module pyspark.sql.dataframe:

join(other: 'DataFrame', on: Union[str, List[str], pyspark.sql.column.Column, List[pyspark.sql.column.Column], NoneType] = None, how: Optional[str] = None) -> 'DataFrame' method of pyspark.sql.dataframe.DataFrame instance
    Joins with another :class:`DataFrame`, using the given join expression.

    .. versionadded:: 1.3.0

    .. versionchanged:: 3.4.0
        Supports Spark Connect.

    Parameters
    ----------
    other : :class:`DataFrame`
        Right side of the join
    on : str, list or :class:`Column`, optional
        a string for the join column name, a list of column names,
        a join expression (Column), or a list of Columns.
        If `on` is a string or a list of strings indicating the name of the join column(s),
        the column(s) must exist on both sides, and this performs an equi-join.
    how : str, optional
        default ``inner``. Must be one of: ``inner``, ``cross``, ``outer``,
        ``full``, ``fullouter``, ``full_outer``, ``left``, ``leftouter``, ``left_outer``,
        ``right``, ``rightouter``, ``right_outer``, ``semi``, ``leftsemi``, ``left_semi``,
        ``anti``, ``leftanti`` and ``left_anti``.

    Returns
    -------
    :class:`DataFrame`
        Joined DataFrame.

    Examples
    --------
    The following performs a full outer join between ``df1`` and ``df2``.

    >>> from pyspark.sql import Row
    >>> from pyspark.sql.functions import desc
    >>> df = spark.createDataFrame([(2, "Alice"), (5, "Bob")]).toDF("age", "name")
    >>> df2 = spark.createDataFrame([Row(height=80, name="Tom"), Row(height=85, name="Bob")])
    >>> df3 = spark.createDataFrame([Row(age=2, name="Alice"), Row(age=5, name="Bob")])
    >>> df4 = spark.createDataFrame([
    ...     Row(age=10, height=80, name="Alice"),
    ...     Row(age=5, height=None, name="Bob"),
    ...     Row(age=None, height=None, name="Tom"),
    ...     Row(age=None, height=None, name=None),
    ... ])

    Inner join on columns (default)

    >>> df.join(df2, 'name').select(df.name, df2.height).show()
    +----+------+
    |name|height|
    +----+------+
    | Bob|    85|
    +----+------+
    >>> df.join(df4, ['name', 'age']).select(df.name, df.age).show()
    +----+---+
    |name|age|
    +----+---+
    | Bob|  5|
    +----+---+

    Outer join for both DataFrames on the 'name' column.

    >>> df.join(df2, df.name == df2.name, 'outer').select(
    ...     df.name, df2.height).sort(desc("name")).show()
    +-----+------+
    | name|height|
    +-----+------+
    |  Bob|    85|
    |Alice|  NULL|
    | NULL|    80|
    +-----+------+
    >>> df.join(df2, 'name', 'outer').select('name', 'height').sort(desc("name")).show()
    +-----+------+
    | name|height|
    +-----+------+
    |  Tom|    80|
    |  Bob|    85|
    |Alice|  NULL|
    +-----+------+

    Outer join for both DataFrams with multiple columns.

    >>> df.join(
    ...     df3,
    ...     [df.name == df3.name, df.age == df3.age],
    ...     'outer'
    ... ).select(df.name, df3.age).show()
    +-----+---+
    | name|age|
    +-----+---+
    |Alice|  2|
    |  Bob|  5|
    +-----+---+
temporary = trips \
                .join(zoneLookup, trips.PULocationID == zoneLookup.LocationID) \
                .filter(zoneLookup.Borough != "Unknown") \
                .filter(zoneLookup.Borough != "N/A") \
                .filter(zoneLookup.Zone != "N/A") \
                .filter(zoneLookup.service_zone != "N/A") \
                .select(trips.columns)

temporary = temporary \
                .alias("temporary") \
                .join(zoneLookup.alias("zoneLookup"),F.col("temporary.DOLocationID") == F.col("zoneLookup.LocationID")) \
                .filter(F.col("zoneLookup.Borough") != "Unknown") \
                .filter(F.col("zoneLookup.Borough") != "N/A") \
                .filter(F.col("zoneLookup.Zone") != "N/A") \
                .filter(F.col("zoneLookup.service_zone") != "N/A") \
                .select(F.col("temporary.*"))
# add something here to filter out Unknown values
tripsWithHighestTips = temporary.orderBy(trips.tip_amount, ascending=False).limit(10).collect() # add something here to take the top 10 elements
tripsWithHighestTips
[Row(VendorID=2, tpep_pickup_datetime=datetime.datetime(2022, 1, 29, 2, 23, 46), tpep_dropoff_datetime=datetime.datetime(2022, 1, 29, 2, 32, 6), passenger_count=1.0, trip_distance=1.32, RatecodeID=1.0, store_and_fwd_flag='N', PULocationID=79, DOLocationID=249, payment_type=1, fare_amount=7.0, extra=0.5, mta_tax=0.5, tip_amount=888.88, tolls_amount=0.0, improvement_surcharge=0.3, total_amount=899.68, congestion_surcharge=2.5, airport_fee=0.0),
 Row(VendorID=2, tpep_pickup_datetime=datetime.datetime(2022, 1, 15, 2, 27, 19), tpep_dropoff_datetime=datetime.datetime(2022, 1, 15, 2, 33, 34), passenger_count=5.0, trip_distance=1.3, RatecodeID=1.0, store_and_fwd_flag='N', PULocationID=79, DOLocationID=232, payment_type=1, fare_amount=6.5, extra=0.5, mta_tax=0.5, tip_amount=303.0, tolls_amount=0.0, improvement_surcharge=0.3, total_amount=313.3, congestion_surcharge=2.5, airport_fee=0.0),
 Row(VendorID=2, tpep_pickup_datetime=datetime.datetime(2022, 1, 23, 7, 35, 29), tpep_dropoff_datetime=datetime.datetime(2022, 1, 23, 8, 10, 12), passenger_count=1.0, trip_distance=2.31, RatecodeID=1.0, store_and_fwd_flag='N', PULocationID=132, DOLocationID=132, payment_type=1, fare_amount=22.5, extra=0.0, mta_tax=0.5, tip_amount=250.0, tolls_amount=0.0, improvement_surcharge=0.3, total_amount=274.55, congestion_surcharge=0.0, airport_fee=1.25),
 Row(VendorID=1, tpep_pickup_datetime=datetime.datetime(2022, 1, 27, 13, 57, 38), tpep_dropoff_datetime=datetime.datetime(2022, 1, 27, 14, 25, 11), passenger_count=1.0, trip_distance=15.5, RatecodeID=1.0, store_and_fwd_flag='N', PULocationID=70, DOLocationID=261, payment_type=1, fare_amount=41.5, extra=2.5, mta_tax=0.5, tip_amount=245.83, tolls_amount=6.55, improvement_surcharge=0.3, total_amount=297.18, congestion_surcharge=2.5, airport_fee=0.0),
 Row(VendorID=2, tpep_pickup_datetime=datetime.datetime(2022, 1, 6, 8, 52, 49), tpep_dropoff_datetime=datetime.datetime(2022, 1, 6, 9, 5, 12), passenger_count=2.0, trip_distance=2.22, RatecodeID=1.0, store_and_fwd_flag='N', PULocationID=234, DOLocationID=50, payment_type=1, fare_amount=10.0, extra=0.0, mta_tax=0.5, tip_amount=221.7, tolls_amount=0.0, improvement_surcharge=0.3, total_amount=235.0, congestion_surcharge=2.5, airport_fee=0.0),
 Row(VendorID=1, tpep_pickup_datetime=datetime.datetime(2022, 1, 23, 15, 33), tpep_dropoff_datetime=datetime.datetime(2022, 1, 23, 15, 33, 4), passenger_count=1.0, trip_distance=2.2, RatecodeID=1.0, store_and_fwd_flag='N', PULocationID=226, DOLocationID=226, payment_type=1, fare_amount=2.5, extra=0.0, mta_tax=0.5, tip_amount=200.0, tolls_amount=0.0, improvement_surcharge=0.3, total_amount=203.3, congestion_surcharge=0.0, airport_fee=0.0),
 Row(VendorID=2, tpep_pickup_datetime=datetime.datetime(2022, 1, 25, 6, 55, 47), tpep_dropoff_datetime=datetime.datetime(2022, 1, 25, 7, 3, 37), passenger_count=1.0, trip_distance=1.88, RatecodeID=1.0, store_and_fwd_flag='N', PULocationID=107, DOLocationID=141, payment_type=1, fare_amount=8.0, extra=0.0, mta_tax=0.5, tip_amount=200.0, tolls_amount=0.0, improvement_surcharge=0.3, total_amount=211.3, congestion_surcharge=2.5, airport_fee=0.0),
 Row(VendorID=1, tpep_pickup_datetime=datetime.datetime(2022, 1, 11, 11, 39, 17), tpep_dropoff_datetime=datetime.datetime(2022, 1, 11, 12, 26, 8), passenger_count=1.0, trip_distance=4.4, RatecodeID=1.0, store_and_fwd_flag='N', PULocationID=161, DOLocationID=161, payment_type=1, fare_amount=20.5, extra=2.5, mta_tax=0.5, tip_amount=150.0, tolls_amount=0.0, improvement_surcharge=0.3, total_amount=173.8, congestion_surcharge=2.5, airport_fee=0.0),
 Row(VendorID=2, tpep_pickup_datetime=datetime.datetime(2022, 1, 25, 14, 29, 5), tpep_dropoff_datetime=datetime.datetime(2022, 1, 25, 14, 33, 39), passenger_count=1.0, trip_distance=0.79, RatecodeID=1.0, store_and_fwd_flag='N', PULocationID=229, DOLocationID=233, payment_type=1, fare_amount=5.0, extra=0.0, mta_tax=0.5, tip_amount=125.22, tolls_amount=0.0, improvement_surcharge=0.3, total_amount=133.52, congestion_surcharge=2.5, airport_fee=0.0),
 Row(VendorID=2, tpep_pickup_datetime=datetime.datetime(2022, 1, 11, 13, 52, 11), tpep_dropoff_datetime=datetime.datetime(2022, 1, 11, 13, 52, 25), passenger_count=1.0, trip_distance=0.0, RatecodeID=1.0, store_and_fwd_flag='N', PULocationID=43, DOLocationID=43, payment_type=1, fare_amount=2.5, extra=0.0, mta_tax=0.5, tip_amount=120.0, tolls_amount=0.0, improvement_surcharge=0.3, total_amount=125.8, congestion_surcharge=2.5, airport_fee=0.0)]
from geojson import FeatureCollection, Feature, LineString
def to_lon_and_lat(latLonCoordinate):
    return [latLonCoordinate[1],latLonCoordinate[0]]

def trip_to_geojson(trip):
    start_point = to_lon_and_lat(zoneCenters[trip["PULocationID"]])
    end_point = to_lon_and_lat(zoneCenters[trip["DOLocationID"]])
    props = {
        "starttime":trip["tpep_pickup_datetime"].isoformat(),
        "startzone":trip["PULocationID"],
        "endtime":trip["tpep_dropoff_datetime"].isoformat(),
        "endzone":trip["DOLocationID"],
    }
    return Feature(geometry=LineString([start_point, end_point]), properties=props)

def tripList_to_geojson(tripList):
    coll = FeatureCollection(list(map(lambda item: trip_to_geojson(item),tripList)))
    return coll
trip_geojson = tripList_to_geojson(tripsWithHighestTips)
for i in trip_geojson['features']:
    print(i)

print(trip_geojson['type'])
{"geometry": {"coordinates": [[-73.986487, 40.726759], [-74.003081, 40.733811]], "type": "LineString"}, "properties": {"endtime": "2022-01-29T02:32:06", "endzone": 249, "starttime": "2022-01-29T02:23:46", "startzone": 79}, "type": "Feature"}
{"geometry": {"coordinates": [[-73.986487, 40.726759], [-73.982954, 40.713594]], "type": "LineString"}, "properties": {"endtime": "2022-01-15T02:33:34", "endzone": 232, "starttime": "2022-01-15T02:27:19", "startzone": 79}, "type": "Feature"}
{"geometry": {"coordinates": [[-73.783745, 40.639068], [-73.783745, 40.639068]], "type": "LineString"}, "properties": {"endtime": "2022-01-23T08:10:12", "endzone": 132, "starttime": "2022-01-23T07:35:29", "startzone": 132}, "type": "Feature"}
{"geometry": {"coordinates": [[-73.865871, 40.763273], [-74.013983, 40.707456]], "type": "LineString"}, "properties": {"endtime": "2022-01-27T14:25:11", "endzone": 261, "starttime": "2022-01-27T13:57:38", "startzone": 70}, "type": "Feature"}
{"geometry": {"coordinates": [[-73.990131, 40.73931], [-73.997474, 40.767838]], "type": "LineString"}, "properties": {"endtime": "2022-01-06T09:05:12", "endzone": 50, "starttime": "2022-01-06T08:52:49", "startzone": 234}, "type": "Feature"}
{"geometry": {"coordinates": [[-73.925837, 40.727], [-73.925837, 40.727]], "type": "LineString"}, "properties": {"endtime": "2022-01-23T15:33:04", "endzone": 226, "starttime": "2022-01-23T15:33:00", "startzone": 226}, "type": "Feature"}
{"geometry": {"coordinates": [[-73.984269, 40.736706], [-73.960113, 40.76562]], "type": "LineString"}, "properties": {"endtime": "2022-01-25T07:03:37", "endzone": 141, "starttime": "2022-01-25T06:55:47", "startzone": 107}, "type": "Feature"}
{"geometry": {"coordinates": [[-73.97735, 40.757753], [-73.97735, 40.757753]], "type": "LineString"}, "properties": {"endtime": "2022-01-11T12:26:08", "endzone": 161, "starttime": "2022-01-11T11:39:17", "startzone": 161}, "type": "Feature"}
{"geometry": {"coordinates": [[-73.964284, 40.755784], [-73.969564, 40.746299]], "type": "LineString"}, "properties": {"endtime": "2022-01-25T14:33:39", "endzone": 233, "starttime": "2022-01-25T14:29:05", "startzone": 229}, "type": "Feature"}
{"geometry": {"coordinates": [[-73.966498, 40.781507], [-73.966498, 40.781507]], "type": "LineString"}, "properties": {"endtime": "2022-01-11T13:52:25", "endzone": 43, "starttime": "2022-01-11T13:52:11", "startzone": 43}, "type": "Feature"}
FeatureCollection
m = getMap()
m.add_shp(in_shp=taxizonesFile,layer_name="taxizone")
m.layer_opacity('taxizone', 0.9)
m.add_geojson(in_geojson=trip_geojson,layer_name="connections", style={"color":"red", "width":"4pt"})
m.layer_opacity('connections', 1.0)
m
# Check status of runnning java processes
mycluster.check_status()
[INFO ] [08/05/2025 11:14:30] - Currently, following java processes are running:
[INFO ] [08/05/2025 11:14:30] - 	Process ID, Name
[INFO ] [08/05/2025 11:14:30] - 	387621, SparkSubmit
[INFO ] [08/05/2025 11:14:30] - 	387396, Master
[INFO ] [08/05/2025 11:14:30] - 	387725, CoarseGrainedExecutorBackend
[INFO ] [08/05/2025 11:14:30] - 	387464, Worker
# Stopping spark context
sc.stop()
mycluster.check_status()
[INFO ] [08/05/2025 11:14:31] - Currently, following java processes are running:
[INFO ] [08/05/2025 11:14:32] - 	Process ID, Name
[INFO ] [08/05/2025 11:14:32] - 	387621, SparkSubmit
[INFO ] [08/05/2025 11:14:32] - 	387396, Master
[INFO ] [08/05/2025 11:14:32] - 	387464, Worker
mycluster.stop_cluster()
kill_java_processes_by_name("SparkSubmit")
[INFO ] [08/05/2025 11:14:33] - Stopping SPARK cluster.
[INFO ] [08/05/2025 11:14:36] - Logging cluster stopping info at: ./my-conf/spark/log/cluster.log
Killing process SparkSubmit with PID 387621

----Performance Data----
Duration: 4.49

CPU Util (Across CPUs)       	AVG: 8.71	 MIN: 0.00	 MAX: 50.00
Mem Util in GB (Across nodes)	AVG: 220.47	 MIN: 220.20	 MAX: 220.82
IO Ops (excl.) Read          	Total: 82609
               Write         	Total: 6977
IO Bytes (excl.) Read        	Total: 217.33
                 Write       	Total: 2.26
mycluster.check_status()
[INFO ] [08/05/2025 11:14:38] - Currently, following java processes are running:
[INFO ] [08/05/2025 11:14:39] - 	Process ID, Name