
Connected component labeling#
Conceptionally, label images are an extension of binary images. Binary images have only two values, e.g. 0 and 1, describing background and foreground. In a label image, all pixels with value 0 correspond to background, a special region which is not considered as any object. Pixels with a value larger than 0 denote that the pixel belongs to an object and identifies that object with the given number. A pixel with value 1 belongs to first object and pixels with value 2 belongs to a second object and so on. Ideally, objects are labeled subsequently, which means in an image with 7 objects, all integer intensities between 0 and 7 exist. None is missing. Then, the maximum intensity in the label image corresponds to the number of labeled objects in the image.
See also
import numpy as np
from skimage.measure import label
import stackview
from skimage.io import imread
from skimage.filters import threshold_otsu
import matplotlib.pyplot as plt
We start with a simple mock binary image.
binary_image = np.asarray([
    [1, 1, 0, 0, 0, 0 ,0],
    [0, 0, 1, 0, 0, 0 ,0],
    [0, 0, 0, 1, 1, 1 ,0],
    [0, 0, 0, 1, 1, 1 ,0],
    [1, 1, 0, 0, 0, 0 ,0],
    [1, 1, 0, 0, 1, 1 ,1],
    [1, 1, 0, 0, 1, 1 ,1],
])

stackview.imshow(binary_image)

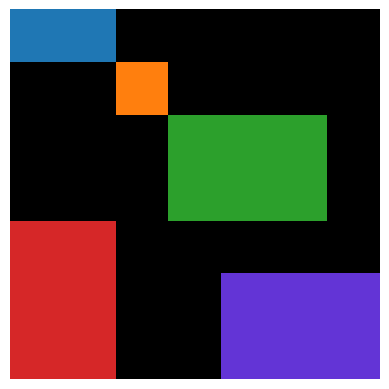
This binary image can be interpreted in two ways: Either there are five rectangles with size ranging between 1 and 6. Alternatively, there are two rectangles with size 6 and one snake-like structure of size 9 pixels.
labeled_4_connected = label(binary_image, connectivity=1)

stackview.imshow(labeled_4_connected)
8-connected component labeling#
from skimage.measure import label
labeled_8_connected = label(binary_image, connectivity=2)

stackview.imshow(labeled_8_connected, labels=True)

In practice, for counting cells, the connectivity is not so important. This is why the connectivity parameter is often not provided.
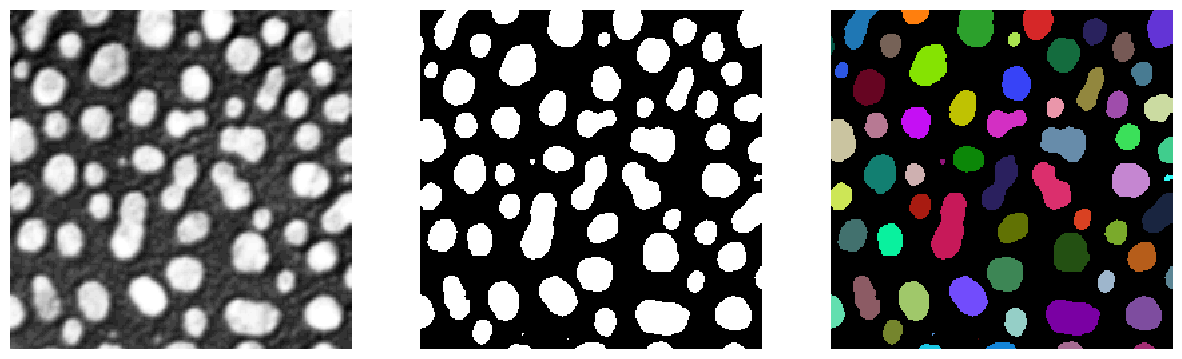
# Load data
blobs = imread("data/blobs.tif")

# Thresholding
threshold = threshold_otsu(blobs)
binary_blobs = blobs > threshold

# Connected component labeling
labeled_blobs = label(binary_blobs)

# Visualization
fig, axs = plt.subplots(1, 3, figsize=(15,15))

stackview.imshow(blobs, plot=axs[0])
stackview.imshow(binary_blobs, plot=axs[1])
stackview.imshow(labeled_blobs, plot=axs[2])
Visualizing segmentation results#
To gain trust in segmentation results, it is key to visualize the segmented image on top of the original image.
stackview.animate_curtain(blobs, labeled_blobs)

stackview.curtain(blobs, labeled_blobs)
stackview.animate_blend(blobs, labeled_blobs)

stackview.blend(blobs, labeled_blobs)
Exercise#
In a single line of code, find out the number of objects in the labeled_blobs image.