Performance Measures#
Similar as for the regression problem, we can run a cross-validation to determine how often the prediction of a model is correct. This can be done by selecting “accuracy” as measure which is optimized during the training.
# code of a previous notebook of this section
import pandas as pd
from sklearn.model_selection import train_test_split
from sklearn.pipeline import make_pipeline
from sklearn.preprocessing import StandardScaler
from sklearn.compose import ColumnTransformer
from sklearn.compose import make_column_selector
import numpy as np
from sklearn.svm import SVC

data = pd.read_csv('cl1_data.csv')

train_set, test_set = train_test_split(data, test_size=0.2, random_state=42)

y_train = train_set['label']
X_train = train_set.drop(['label'], axis=1)

num_pipeline = make_pipeline(StandardScaler())

preprocessing = ColumnTransformer([("num",num_pipeline, make_column_selector(dtype_include=np.number))])

model_svc = make_pipeline(preprocessing, SVC(kernel='rbf', C=1.0))
model_svc.fit(X_train, y_train)
# end of code from a previous notebook of this section

from sklearn.model_selection import cross_val_score

scores_accuracy = cross_val_score(model_svc, X_train, y_train, cv=5, scoring="accuracy")
print(f"Accuracy of each set:\n{scores_accuracy}\n")
print("This is an average accuracy of %0.3f." % (scores_accuracy.mean()))
Accuracy of each set:
[0.9425 0.9525 0.955  0.96   0.9425]

This is an average accuracy of 0.951.
Thus, 95 % of the labels “group1” and “group2” are correctly assigned for the training data set. This sounds really good. But how good is the accuracy of a classification algorithm assigning the label “group1” independent of the input features to our data set:
from sklearn.dummy import DummyClassifier
model_dummy = DummyClassifier(strategy='prior')
model_dummy.fit(X_train, y_train)

scores_dummy = cross_val_score(model_dummy, X_train, y_train, cv=5, scoring="accuracy")
print(f"Accuracy of each set:\n{scores_dummy}\n")
print("This is an average accuracy of %0.3f." % (scores_dummy.mean()))
Accuracy of each set:
[0.795  0.795  0.7975 0.7975 0.7975]

This is an average accuracy of 0.796.
We have already an accuracy close to 80% since 80% of the instances have the label “group1”. Thus, the accuracy is an overall poor metric for validation since it is strongly affected by the number of instances per class. A better choice might be metrics based on the confusion matrix. The confusion matrix can be calculated by scikit-learn as follow:
from sklearn.model_selection import cross_val_predict
from sklearn.metrics import confusion_matrix

y_train_svc_pred = cross_val_predict(model_svc, X_train, y_train, cv=5)

cm = confusion_matrix(y_train, y_train_svc_pred)
print(cm)
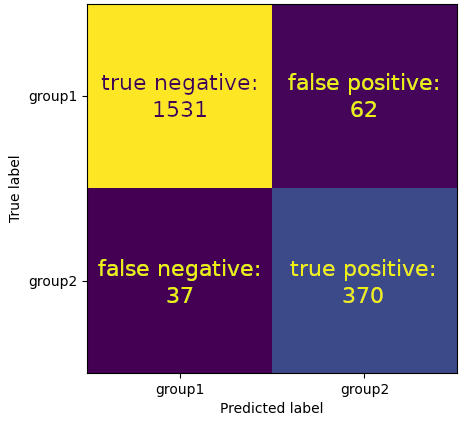
[[1531   62]
 [  37  370]]
The confusion matrix consists of 4 entries. The first entry at row 1, column 1 is the number of true false (\(TF\)) instances. These instances have the label “group1” (false, not group2) and were correctly classified as “group1” (false). The entry at row 1, column 2 are false positive (\(FP\)) instances. These instances have the label “group1” (false) but were predicted as “group2” (true). The number of false negative (\(FN\)) instances is on row 2, column 1. These instances have the label “group2” (true) but were predicted as “group1” (false). Finally, we have the number of true positive (\(TP\)) instances on row 2, column 2. These are the instances correctly predicted as “group2” (true).
Thus, the sum of the first row is the number of the “group1” (false) labels in the training data set while the sum of the second row is the number of “group2” (true) labels in the training data set.
y_train.value_counts()
label
group1    1593
group2     407
Name: count, dtype: int64
The sum of the first column refers to instances predicted as “group1” (false) while the second column refers to the sum of instances predicted as “group2” (true).
pd.Series(y_train_svc_pred).value_counts()
group1    1568
group2     432
Name: count, dtype: int64
We can use the entries of the confusion matrix to calculate different metrics. The first one is precision:
\(precision = \frac{TP}{FP+TP}\)
A precision close to 1 highlights that instances predicted as “group2” (true) are correctly predicted. Thus, we can trust our “group2” predictions that they are really an element of the “group2” class. We can access precision for our cross validation by:
from sklearn.metrics import precision_score, make_scorer

precision = make_scorer(precision_score, pos_label='group2')

scores_precision = cross_val_score(model_svc, X_train, y_train, cv=5, scoring=precision)
print(f"Precision of each set:\n{scores_precision}\n")
print("This is an average precision of %0.3f \n" % (scores_precision.mean()))
Precision of each set:
[0.82417582 0.85393258 0.86206897 0.87356322 0.87179487]

This is an average precision of 0.857
If you want to determine the precision for the test data set, use following code:
y_test = test_set['label']
X_test = test_set.drop(['label'], axis=1)

y_pred_test = model_svc.predict(X_test)
precision_test = precision_score(y_test, y_pred_test, pos_label='group2')
print("The model has a precision of %0.2f on the test data set\n" % precision_test)
The model has a precision of 0.80 on the test data set
A classifier that always makes “group2” predictions except for a single instance with the highest confidence for “group1” will have a precision of one. This is not desirable. Therefore, a complementary metric is reasonable. This is the recall, also called sensitivity or the true positive rate:
\(recall = \frac{TP}{FN+TP}\)
We can access it for our cross validation by:
from sklearn.metrics import recall_score

recall = make_scorer(recall_score, pos_label='group2')

scores_recall_svc = cross_val_score(model_svc, X_train, y_train, cv=5, scoring=recall)

print(f"Recall of each set:\n{scores_recall_svc}\n")
print("This is an average recall of %0.3f \n" % (scores_recall_svc.mean()))
Recall of each set:
[0.91463415 0.92682927 0.92592593 0.9382716  0.83950617]

This is an average recall of 0.909
Precision and recall are combined in the \(F_1\) score given as:
\(F_1 = \frac{2}{\frac{1}{precision}+\frac{1}{recall}} = \frac{2TP}{2TP+FP+FN}\)
Thus, a high \(F_1\) score refers to a high recall and precision since it is the harmonic mean of precision and recall. Please note, the harmonic mean is stronger affected by small values than the mean value. You can get the \(F_1\) score by:
from sklearn.metrics import f1_score

f1 = make_scorer(f1_score, pos_label='group2')

scores_f1_svc = cross_val_score(model_svc, X_train, y_train, cv=5, scoring=f1)

print(f"F1-score of each set:\n{scores_f1_svc}\n")
print("This is an average f1-score of %0.3f \n" % (scores_f1_svc.mean()))
F1-score of each set:
[0.86705202 0.88888889 0.89285714 0.9047619  0.85534591]

This is an average f1-score of 0.882