Exercise#
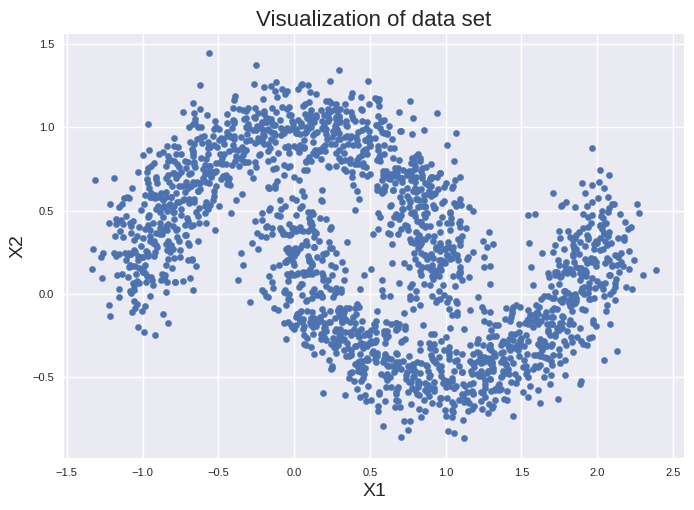
You find in the directory of this jupyter notebook the file “cluster_exercise_data.csv”. Compare Gaussian mixtures and HDBSCAN to cluster this data set.
import pandas as pd
import matplotlib.pyplot as plt

X = pd.read_csv('cluster_exercise_data.csv')

plt.style.use('seaborn-v0_8')

plt.scatter(X["X1"], X["X2"], s=20)
plt.title("Visualization of data set", fontsize=16)
plt.xlabel("X1", fontsize=14)
plt.ylabel("X2", fontsize=14)
plt.tick_params(labelsize=8)

plt.show()
# your code here