Plotting in 3D with plotly#
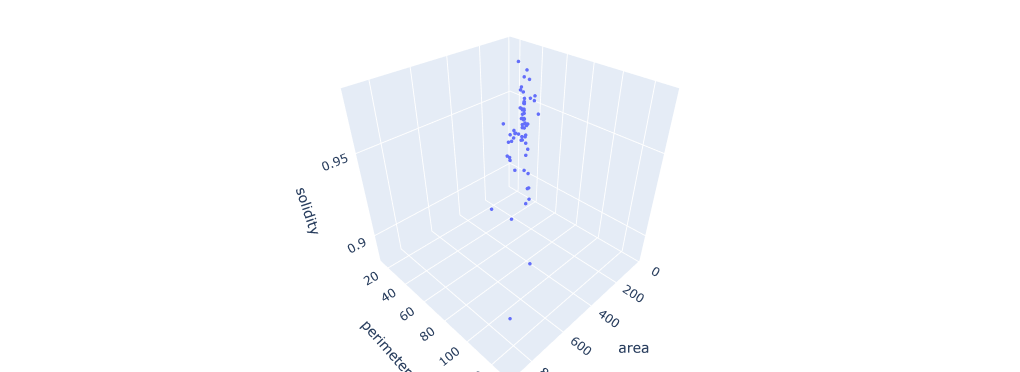
As plotly offers interactive plots, it becomes feasible to create a 3D plot and rotate it using mouse-interaction.
from datetime import datetime
import pandas as pd
import plotly.express as px
df = pd.read_csv("data/blobs_measurements.csv")
df.head()
| Unnamed: 0 | label | area | mean_intensity | max_intensity | min_intensity | centroid-0 | centroid-1 | eccentricity | solidity | perimeter | centroid_x | centroid_y | |
|---|---|---|---|---|---|---|---|---|---|---|---|---|---|
| 0 | 0 | 1 | 27.0 | 149.333333 | 168.0 | 128.0 | 26.259259 | 0.666667 | 0.973991 | 0.900000 | 20.621320 | 0.666667 | 26.259259 |
| 1 | 1 | 2 | 203.0 | 199.960591 | 240.0 | 128.0 | 225.876847 | 3.955665 | 0.892348 | 0.966667 | 59.591883 | 3.955665 | 225.876847 |
| 2 | 2 | 3 | 503.0 | 198.695825 | 248.0 | 128.0 | 97.487078 | 7.836978 | 0.801503 | 0.971042 | 86.870058 | 7.836978 | 97.487078 |
| 3 | 3 | 4 | 264.0 | 189.939394 | 232.0 | 120.0 | 139.545455 | 7.159091 | 0.605384 | 0.977778 | 58.041631 | 7.159091 | 139.545455 |
| 4 | 4 | 5 | 96.0 | 166.416667 | 200.0 | 128.0 | 44.812500 | 7.833333 | 0.628475 | 0.960000 | 34.142136 | 7.833333 | 44.812500 |
The scatter_3d function offers interactive 3D plots.
fig = px.scatter_3d(df,
                    x="area",
                    y="perimeter",
                    z="solidity")
fig.update_traces(marker_size = 2)  # Make dots smaller
fig.update_layout(margin=dict(l=0, r=0, b=0, t=0)) # Reduce figure margins
fig.show()

Exercise#
Configure the plot above so that eccentricity is colour-coded in the plot.
