Generating notebooks#
When working on complex tasks, it may make sense to generate an entire notebook for the task. Hence, we can ask bob to generate a notebook for a series of tasks.
from skimage.io import imread
import stackview
from bia_bob import bob
%%bob
Please write a new notebook "Blob_Segmentation_Analysis.ipynb" that does the following:
* open blobs.tif,
* segment the bright objects
* measure their area and perimeter
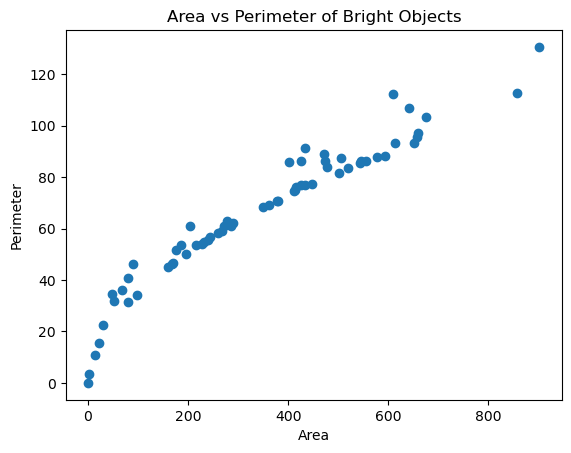
* plot the area against perimeter
A notebook has been saved as Blob_Segmentation_Analysis.ipynb.
Generating a notebook using vision capabilities#
The model we’re using per default has vision capabilities. Thus, we can pass an image to bob and ask it to create a notebook for segmenting it:
hela_cells = imread("hela-cells-8bit.tif")
stackview.insight(hela_cells)
|
|
|
%%bob hela_cells
Please write a new Jupyter notebook for processing this image.
Its filename is `hela-cells-8bit.tif`.
At the beginning of the notebook describe the image it is made for.
I would like to segment the objects in the blue channel.
Write Python-code for doing this and please add explanatory notebook
cellls in between explaining what you're doing in detail as I'm a
Python-beginner.

Thanks :-)
A notebook has been saved as hela_cell_segmentation.ipynb.
Generating no notebook#
Note, if we don’t ask for the notebook explicitly, Bob will write a huge code block, which might be less readable.
%%bob
Please do the following:
* open blobs.tif,
* segment the bright objects
* measure their area and perimeter
* plot the area against perimeter
To solve this task, I will open the “blobs.tif” image, segment the bright objects using Otsu thresholding, measure their area and perimeter using scikit-image’s regionprops, and finally plot the area against the perimeter using matplotlib.
from skimage import io, filters
from skimage.measure import label, regionprops
import matplotlib.pyplot as plt

# Open blobs.tif
image = io.imread('blobs.tif')

# Segment the bright objects using Otsu thresholding
threshold = filters.threshold_otsu(image)
segmented = image > threshold

# Label the segmented objects
labeled_image = label(segmented)

# Measure area and perimeter of each labeled object
properties = regionprops(labeled_image)
areas = [prop.area for prop in properties]
perimeters = [prop.perimeter for prop in properties]

# Create a scatter plot of area vs perimeter
plt.scatter(areas, perimeters)
plt.xlabel('Area')
plt.ylabel('Perimeter')
plt.title('Area vs Perimeter of Bright Objects')
plt.show()

