Open Weight VLMs for Counting objects#
In this notebook we use open weight LLMs with vision capabilities to see how well they can count blobs in blobs.tif .
Note: It is not recommended to use this approach for counting objects in microscopy images. The author of this notebook is not aware of any publication showing that this approach works well.
import openai
import PIL
import stackview
from skimage.io import imread
from skimage.measure import label
from skimage.segmentation import clear_border
import pandas as pd
import seaborn as sns
import matplotlib.pyplot as plt
import numpy as np
from tqdm import tqdm
We will need some helper functions for assembling a prompt and submitting it to the llm server.
def prompt_with_image(prompt:str, image, model="gemma3:4b", ollama_url="http://localhost:11434"):
    """A prompt helper function that sends a text message and an image
    to openAI and returns the text response.
    """
    import os

    if image is not None:
        message = image_to_message(image, prompt)
    else:
        message = [{"role": "user", "content": prompt}]


    # setup connection to the LLM
    client = openai.OpenAI(base_url=f"{ollama_url}/v1",)

    # submit prompt
    response = client.chat.completions.create(
        model=model,
        messages=message
    )

    # extract answer
    answer = response.choices[0].message.content
    if "</think>" in answer:
        answer = answer.split("</think>")[1].strip()

    return answer


def image_to_message(image, prompt):
    import base64

    from stackview._image_widget import _img_to_rgb

    rgb_image = _img_to_rgb(image)
    byte_stream = numpy_to_bytestream(rgb_image)
    base64_image = base64.b64encode(byte_stream).decode('utf-8')

    return [{"role": "user", "content": [
        {"type": "text", "text": prompt},
        {"type": "image_url",
        "image_url": {
            "url": f"data:image/jpeg;base64,{base64_image}"
        }

    }]}]


def numpy_to_bytestream(data):
    """Turn a NumPy array into a bytestream"""
    import numpy as np
    from PIL import Image
    import io

    # Convert the NumPy array to a PIL Image
    image = Image.fromarray(data.astype(np.uint8)).convert("RGBA")

    # Create a BytesIO object
    bytes_io = io.BytesIO()

    # Save the PIL image to the BytesIO object as a PNG
    image.save(bytes_io, format='PNG')

    # return the beginning of the file as a bytestream
    bytes_io.seek(0)
    return bytes_io.read()
image = imread("data/blobs.tif")
image = np.stack([image,image,image],axis=2)
stackview.insight(image)

|

|
labels = label(image[...,0] > 128)

stackview.insight(labels)

|
|
labels_wo_border = clear_border(labels)

stackview.insight(labels_wo_border)

|
|
||||||||||||||
This is the prompt we submit to the server.
my_prompt = """
Analyse the following image by counting the bright blobs. If you think you're not able to do this, try anyway. Respond with the number only.
"""

prompt_with_image(my_prompt, image=image, model="gemma3:4b")
'87'
Benchmarking vision-LLMs#
We can run this prompt in a loop for a couple of vision models.
num_samples = 25

models = {
    "gemma3:4b":[],
    "gemma3:12b":[],
}
for model in tqdm(models.keys()):
    samples = []

    while len(samples) < num_samples:
        result = prompt_with_image(my_prompt, image=image, model=model).strip()
        if result.endswith("."):
            result = result[:-1]

        try:
            samples.append(int(result))
        except:
            print("Error processing result:", result)
            samples.append(np.nan)

    models[model] = samples

sampled_models = pd.DataFrame(models)
100%|████████████████████████████████████████████████████████████████████████████████████| 2/2 [02:27<00:00, 73.77s/it]
Let’s get an overview about samples:
# Extract the two columns for comparison
columns_to_plot = sampled_models[models.keys()]

# Melt the dataframe to prepare for plotting
df_melted = columns_to_plot.melt(var_name='Model', value_name='Blob count')

# Draw the violin plot
plt.figure(figsize=(4, 4))
sns.violinplot(x='Model', y='Blob count', data=df_melted)

plt.title('Vision models counting blobs')
#plt.ylim(0, 150)  # Set the y-axis limits
plt.xticks(rotation=90)  # Rotate the x-axis labels
plt.show()
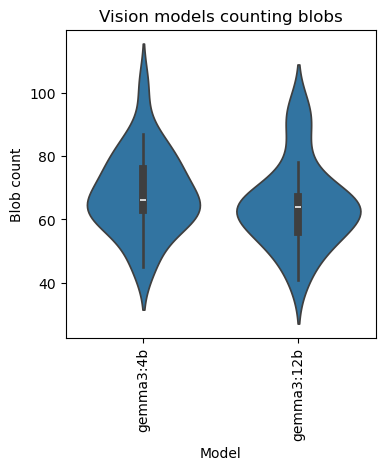
These are the results in detail:
sampled_models
| gemma3:4b | gemma3:12b | |
|---|---|---|
| 0 | 63 | 62 |
| 1 | 74 | 65 |
| 2 | 45 | 66 |
| 3 | 76 | 56 |
| 4 | 63 | 67 |
| 5 | 63 | 57 |
| 6 | 73 | 64 |
| 7 | 67 | 53 |
| 8 | 84 | 55 |
| 9 | 58 | 64 |
| 10 | 58 | 95 |
| 11 | 63 | 75 |
| 12 | 63 | 65 |
| 13 | 83 | 51 |
| 14 | 78 | 78 |
| 15 | 53 | 68 |
| 16 | 47 | 93 |
| 17 | 73 | 64 |
| 18 | 66 | 54 |
| 19 | 60 | 62 |
| 20 | 87 | 41 |
| 21 | 78 | 88 |
| 22 | 63 | 65 |
| 23 | 102 | 45 |
| 24 | 67 | 62 |
sampled_models.describe()
| gemma3:4b | gemma3:12b | |
|---|---|---|
| count | 25.000000 | 25.000000 |
| mean | 68.280000 | 64.600000 |
| std | 12.846919 | 13.235054 |
| min | 45.000000 | 41.000000 |
| 25% | 63.000000 | 56.000000 |
| 50% | 66.000000 | 64.000000 |
| 75% | 76.000000 | 67.000000 |
| max | 102.000000 | 95.000000 |
sampled_models.to_csv("blob_count_by_vlms.csv")