Opening and visualizing images#
Most images with standard extensions (tif, png etc.) can be read using the skimage.io.imread function.
See also
To use imread you have three possibilities:
use the absolute path to an image file e.g.
imread('/Users/username/Desktop/blobs.tif')use a relative path to where you currently are, e.g.
imread('data/blobs.tif')orimread('../../data/blobs.tif')use a url that points to an image file, e.g. from a GitHub repository
imread('https://github.com/haesleinhuepf/BioImageAnalysisNotebooks/raw/main/data/blobs.tif')
Here we use a relative path. Respective to the current notebook, the data in a sub-folder called data:
from skimage.io import imread

image = imread("data/blobs.tif")
Displaying images#
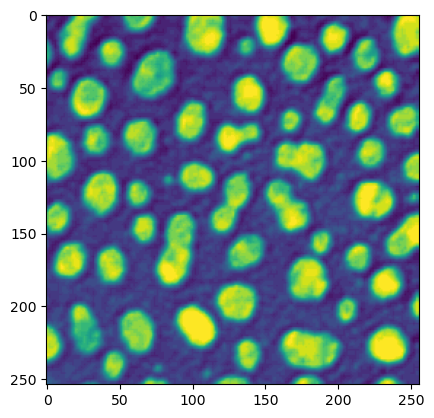
There are many ways to display simple 2D images. In many notebooks and examples online, you will find examples using Matplotlib’s imshow function:
from matplotlib import pyplot as plt

plt.imshow(image);
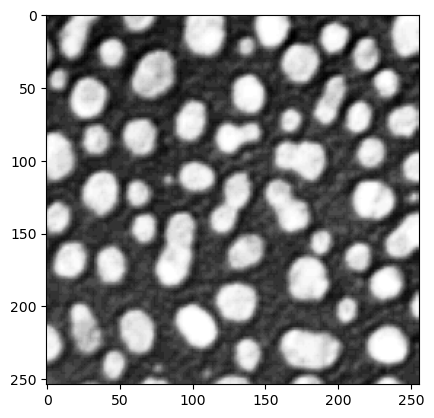
Lookup tables (a.k.a. color maps)#
We can also change the color map, a.k.a. “lookup table” for the visualization.
plt.imshow(image, cmap="Greys_r")
<matplotlib.image.AxesImage at 0x7f447c0c26d0>
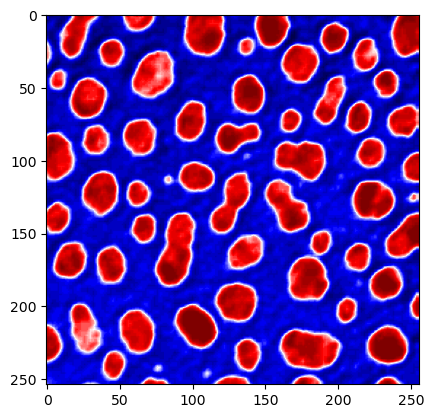
plt.imshow(image, cmap="seismic")
<matplotlib.image.AxesImage at 0x7f447a719160>
Exercise#
Open the banana020.tif data set and visualize it in a yellowish colormap.